| OCR Text |
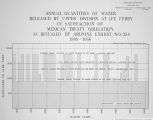
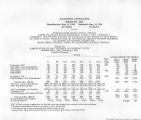
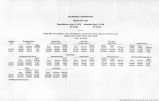
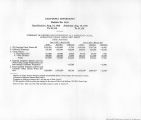
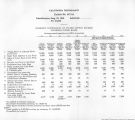
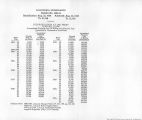
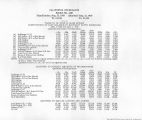
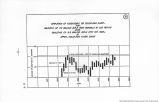
Show CALIFORNIA DEFENDANTS Exhibit No. 5532 Identification: Aug. 19, 1958 Admitted: Aug. 19, 1958 Tr. 21,114 Tr. 21,125 ORDERS AND DIVERSIONS OF COLORADO RIVER BELOW HOOVER DAM (Units: Acre-Feet) 1 2 3 4 5 6 7 8 9 10 11 12 13 14 15 16 17 18 19 20 21 22 23 24 Palo Verde All-American Yuma Proj ect Gila< Gravity Metropolitan Colorado River Irrigation Flow above Desilting Works Canal Reservation Valley California Mair l Canal Mexico Water District Indian Reservation District Imperial Dam Return Station 60 Division Division Wasteway Station 30 Total Total Master Actual Actual Actual Arr. Limi- Orders Diversions2 Order Diversion Order Diversion Order Diversion Schedule Flow Schedule Return Order Diversion Order Diversion Order Diversion Schedule Flow Order Diversion Order trophe Sec.1 June 1956 34,800 35,758 37,690 37,460 96,570 103,300 661,700 676,000 10,830 11,090 495,900 497,400 8,570 9,680 37,390 31,640 71,540 76,440 68,770 68,270 184,685 200,290 857,700 861,500 July 36,700 36,754 44,230 43,770 105,200 104,400 751,000 758,700 11,480 11,880 506,500 508,500 10,760 11,350 36,300 32,170 74,760 78,720 70,990 66,860 256,994 277,270 957,300 950,400 August 46,000 44,916 45,370 44,780 107,100 103,700 718,400 715,500 11,070 11,520 488,100 482,600 11,220 10,530 33,220 30,540 77,320 81,160 72,500 68,240 244,925 267,480 937,700 919,500 September 47,100 47,620 37,410 27,190 87,770 92,490 572,600 583,600 10,710 11,390 438,800 446,400 8,590 8,000 38,280 35,590 63,210 68,040 66,330 64,690 154,630 169,910 779,500 776,400 October 49,700 49,699 26,690 18,990 73,840 75,190 465,700 473,600 11,170 11,160 393,900 407,900 8,420 6,490 37,590 25,510 11,960 37,530 54,170 46,520 55,371 86,480 652,900 627,300 November 48,600 47,451 13,690 10,920 59,310 61,880 336,000 332,600 11,190 11,640 282,100 280,200 5,690 4,170 26,680 21,860 11,440 19,920 36,850 30,930 53,588 69,710 493,900 476,700 December 49,100 49,501 11,150 10,790 58,070 54,750 279,100 283,400 12,670 12,630 218,000 223,900 5,630 3,760 21,220 16,180 8,770 13,410 41,990 37,380 55,371 70,120 437,600 430,900 January 1957 48,500 48,151 12,600 10,840 47,700 45,410 242,000 246,500 9,720 7,910 196,800 193,700 5,930 3,700 24,100 15,450 7,850 14,670 26,960 23,130 55,370 83,710 389,800 369,800 February 44,600 41,801 9,300 10,990 46,220 54,370 295,300 305,700 8,770 10,230 242,400 254,600 5,470 5,200 27,370 22,400 13,510 26,020 38,440 34,550 50,020 72,000 426,200 430,500 March 50,000 51,016 26,480 26,000 87,670 76,550 498,700 511,500 11,680 12,260 425,000 432,600 7,800 8,660 32,130 26,680 57,360 67,430 56,250 57,720 101,100 121,180 700,800 689,800 April 42,500 43,540 30,250 26,120 81,700 75,010 655,900 666,800 13,670 14,880 498,500 499,100 8,710 7,830 33,120 24,540 75,690 83,430 60,600 58,110 193,060 215,740 844,600 826,400 May 59,000 57,852 28,360 25,350 92,980 81,060 575,600 572,500 15,150 15,870 480,800 480,800 8,750 8,580 34,810 29,300 57,340 60,510 66,490 64,790 112,120 120,730 797,600 777,300 xBeginning January 1, 1956, diversions from the limitrophe section by United States users have been taken into account in computing figures shown in column 22. 2Includes all measured diversions in United States plus column 21, less column 18. Mexico assumed to divert as ordered, since complete record of Mexican diversions is not available. Note: Data concerning actual flows and diversions are provisional records, subject to revision, except for data shown in column 22 for period June through December, which are final records in International Boundary and Water Commission. With the exception of figures in columns 2, 21, and 22, all figures shown are rounded to the nearest 10 acre-feet or to four significant figures, as applicable. July 17,1957 |


