| OCR Text |
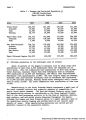
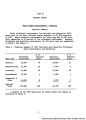
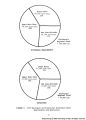
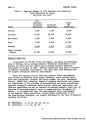
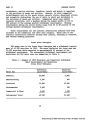
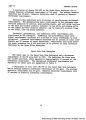
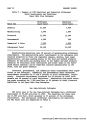
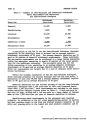
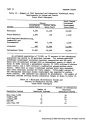
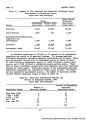
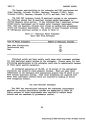
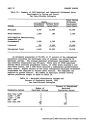
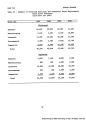
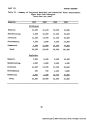
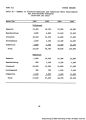
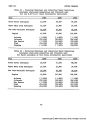
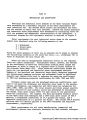
Show PART IV METHODOLOGY AND ASSUMPTIONS 2. Develop Rural-Domestic Water-Use Rate. The 1965 rural-domestic withdrawal water-use rate in the Green River, Upper Main Stem and San Juan-Colorado Subregions was estimated to be 60, 60 and 50 gpcd, respectively (11) (31). Further, this rate was estimated to remain the same in the Green River Subregion and to increase to 75 gpcd in the Upper Main Stem Subregion and to 65 gpcd in the San Juan-Colorado Subregion by the year 2020. The water-use rate by Indians living in rural areas is much less than the average rural-domestic rates shown above. Because of the rela- tively large number of rural Indians living in the San Juan-Colorado Sub- region water requirements for the rural-domestic population in the San Juan-Colorado Subregion were adjusted to reflect water use by the Indian population. The withdrawal water-use rate by the Indian population was estimated to be 28 gpcd in 1965 and to increase to 65 gpcd by 2020. Indian populations in the other subregions were not large enough for inde- pendent consideration. 3. Determine the Weighted-Average Household Water-Use Rate. To determine a weighted-average household withdrawal water-use coefficient for each subregion, it was first necessary to determine the percentage breakdown of the population served by municipal, rural, and Indian systems. A lengthy procedure was used which utilized 1960 and estimated 1965 county population data and the estimated population served by municipal systems in 1963 from U. S. Public Health Service inventories (36). The basic assumption in the procedure was that changes in population served by rural systems from 1960 to 1965 would occur at the same rate as changes in the farm labor force (45). As a result of this procedure, for example, it was estimated that in the Upper Main Stem Subregion in 1965, a population of 101,225 were served by municipal systems and a population of 35,500 were served by rural-domestic systems. The population served by each system multiplied by the withdrawal rate (gpcd) for each system gives total water use in million gallons per day (mgd). The proportion of the population served by municipal and rural systems in the Green River and San Juan-Colorado Subregions was estimated to remain the same in future target years. The proportion of the population served by municipal systems in the Upper Main Stem Subregion was estimated to increase from 74 percent in 1965 to 81 percent in 2020. The 1965 household sector weighted-average withdrawal coefficients for the Green River and Upper Main Stem Subregions in each year were developed as illustrated by the following example for the Upper Main Stem Subregion. 51 |