| OCR Text |
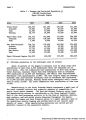
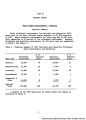
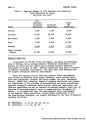
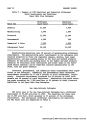
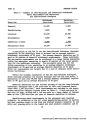
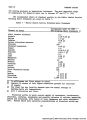
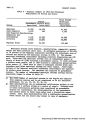
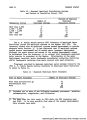
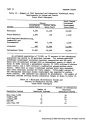
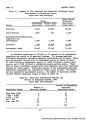
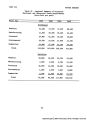
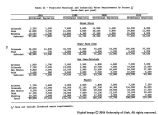
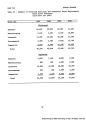
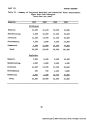
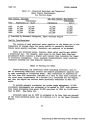
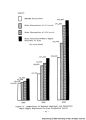
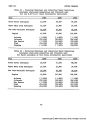
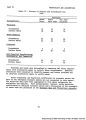
Show PART III FUTURE DEMANDS Table 31 - Projected Municipal and Industrial Water Depletions (excludes stock-pond evaporation and livestock use) for the 8.16 M.A.F. State Alternative (acre-feet) Area 1980 2000 2020 Green River Subregion 13,400 Upper Main Stem Subregion 16,200 San Juan-Colorado Subregion 18,200 Region 47,800 Arizona ( 2,900) Colorado (22,100) New Mexico ( 7,200) Utah (10,100) Wyoming ( 5,500) 29,500 31,900 34,500 95,900 ( 4,800) (50,000) (13,600) (20,200) ( 7,300) 78,300 54,400 59,100 191,800 ( 7,200) (84,100) (29,100) (42,500) (28,900) Table 32 - Projected Municipal and Industrial Water Depletions (excludes stock-pond evaportion and livestock use) for Water available at Site State Alternative (acre-feet) Area 1980 2000 2020 Green River Subregion 18,400 Upper Main Stem Subregion 16,200 San Juan-Colorado Subregion 18,200 Region 52,800 Arizona ( 2,900) Colorado (22,100) New Mexico ( 7,200) Utah (10,100) Wyoming (10,500) 41,500 31,900 34,500 107,900 ( 4,800) (50,000) (13,600) (20,200) (19,300) 88,300 54,400 59,100 201,800 ( 7,200) (84,100) (29,100) (42,500) (38,900) 46 |