| OCR Text |
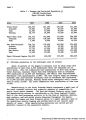
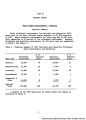
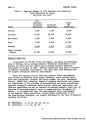
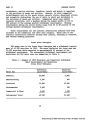
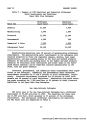
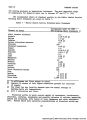
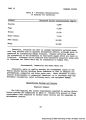
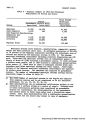
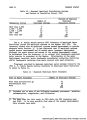
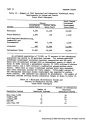
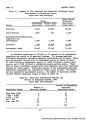
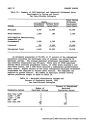
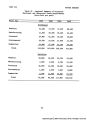
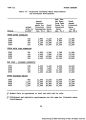
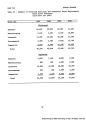
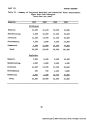
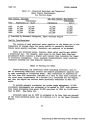
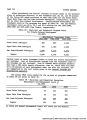
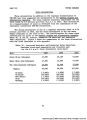
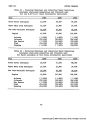
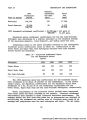
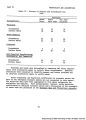
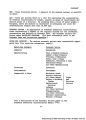
Show PART III FUTURE DEMANDS After considering the spatial relation of future needs to the delivery areas of authorized projects, it was estimated that 30, 20, and 30 percent of the future M&I needs projected in each time frame for the Green River, Upper Main Stem, and San Juan-Colorado Subregions, respectively, would be met by other than federal development. Single-purpose development and treatment costs of the programs are shown in Table 28. The non-federal investment costs are $2.6, $6.5 and $9.0 million for the 1966-1980, 1981-2000 and 2001-2020 time frames, respectively. Table 28 - Municipal and Industrial Program Costs for Single-Purpose Development ($1,000) Non-Federal Investment Costs 1966-1980 1981-2000 2001-2020 Green River Subregion 360 890 1,420 Upper Main Stem Subregion 340 1,380 1,630 San Juan-Colorado Subregion 1,900 4,270 5,970 Region 2,600 6,540 9,020 Capital costs of water treatment plants to treat all future requirements are included. Cost of distribution systems from the treatment plant to the consumer are not included. Cost of federal multi-purpose projects that have a M&I water supply allocation, that is, those that will meet 70 to 80 percent of each subregional need, are also not included, but are summarized in the cost totals given in the General Program and Alternatives Appendix. The annual OM&R costs needed for the up-keep of programs summarized in Table 28 are given in Table 29. Table 29 - Municipal and Industrial Operation, Maintenance and Replacement Costs If ($1,000) 1980 2000 2020 Green River Subregion Upper Main Stem Subregion San Juan-Colorado Subregion 57 95 153 131 232 264 201 345 384 Region 305 627 930 1/ Costs are annual incremental costs; all costs are non-Federal. 43 |