| OCR Text |
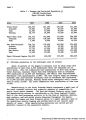
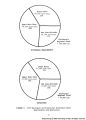
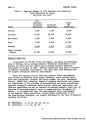
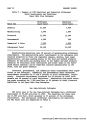
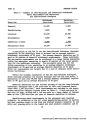
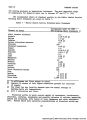
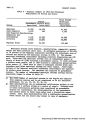
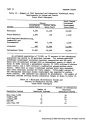
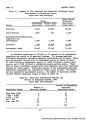
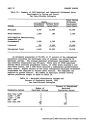
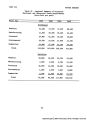
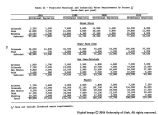
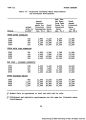
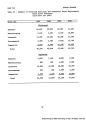
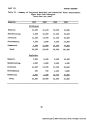
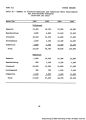
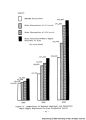
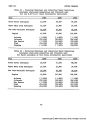
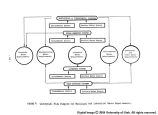
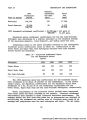
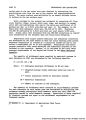
Show PART IV METHODOLOGY AND ASSUMPTIONS Municipal and industrial water demands in the Upper Colorado Region were determined by a systematic analysis of the water requirements for each industrial use. The systems which collect and distribute the water and the sources of supply were also analyzed. Present and future municipal and industrial water requirements were determined by correlating water use with the economic and demographic characteristics of the subregions. A conceptual diagram for this systematic analysis is depicted in Figure 3. Water requirements for each industrial sector shown in the economic models were developed using the following measures of use: W = Withdrawal R = Return water D = Depletion Using the above measures of water use an equation can be drawn to express the equilibrium condition in the water-use cycle, i.e., withdrawal (W) is equal to depletion (D) plus return (R). Water-use data by disaggregated industrial sectors at the regional level are almost nonexistent. Considerable effort, however, was devoted to the development of water-use coefficients relating water intake and depletions to value of output on a regional basis in recent studies of the Colorado River Basin (45). These water-use coefficients formed the basis for the municipal and industrial water requirements analysis. Members of the Municipal and Industrial Water Supply Workgroup suggested and incorporated numerous revisions and refinements based on additional research and limited field work in updating the water-use coefficients to 1965 and developing projected coefficients for 1980, 2000 and 2020. Economic output data and the developed water-use coefficients, were used to estimate the withdrawal and depletion water needs in the manufac- turing, governmental, and commercial and other water-use categories for 1965, 1980, 2000, and 2020. The total present and future annual quantity of water required by each ecomonic sector was determined by multiplying the annual total gross output (TGO) for each sector by the appropriate water-use coefficient. For example, the Food and Kindred Products sector in the Upper Main Stem Subregion had a 1965 total gross output of $20.4 million, a withdrawal coefficient of 14.7 gallons per dollar, and a depletion coefficient of 3.1 gallons per dollar. This yields 299.9 million gallions and 63.2 million gallons as the 1965 withdrawal and depletion requirement s, respec tively. Water xequirements for all other manufacturing, commercial and governmental sectors were similarly developed for each economic subregion 48 |