| OCR Text |
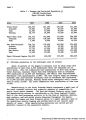
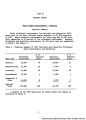
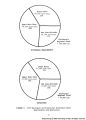
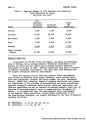
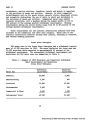
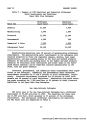
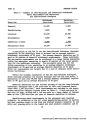
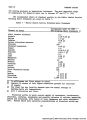
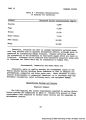
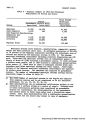
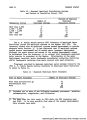
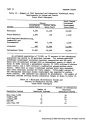
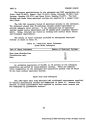
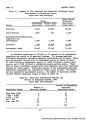
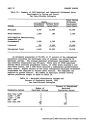
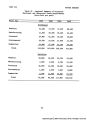
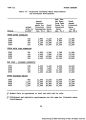
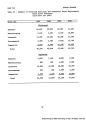
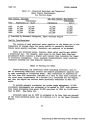
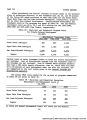
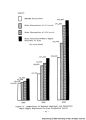
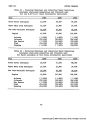
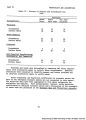
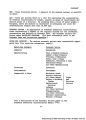
Show PART II PRESENT STATUS Table 15 - Summary of 1965 Municipal and Industrial Withdrawal Water Requirements by System and Source Upper Main Stem Subregion Source Total System Withdrawal System Groundwater (acre-feet) Surface Water (acre-feet) Requirement (acre-feet) Municipal 8,400 19,800 28,200 Rural-Domestic 1,900 200 2,100 Self-Supplied Manufacturing Commercial and Governmental > 2,100 6,500 8,600 Livestock 200 11,000 11,200 Subregional Total 12,600 37,500 50,100 An estimated population of 101,400, or 74 percent of the subregional population was served by 69 municipal systems. The average municipal withdrawal requirement excluding reservoir evaporation was 243 gpcd. There were 64 municipal systems with an independent source of supply of which 25 (39%) utilized a groundwater source, 31 (48%) utilized a surface water source, and 8 (13%) utilized a combination ground-surface source. There were at least 5 municipal systems which were dependent upon other municipal systems for their supply. Sixty-nine percent of the subregional municipal withdrawal requirement was supplied by surface water sources. The remain- der was supplied by groundwater sources. The number of municipal systems serving various population ranges is shown on Table 16. Table 16 - Municipal Distribution Systems and Percent of Population Served, 1965 Upper Main Stem Subregion Percent of Subregional Number of Municipal Population Served Municipal Systems Population Served More than 5,000 4 52 2,000 - 4, 999 8 23 1,000 - 1, 999 6 8 500 - 999 15 10 Less than 500 31 * 64 100 29 |