| OCR Text |
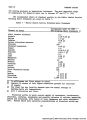
Show PART IV METHODOLOGY AND ASSUMPTIONS economy based on total gross output data contained in the Economic Base and Projections Appendix. Recirculation, encouraged in part by increasing water costs and future water quality needs, was considered as having the largest future impact on the withdrawal coefficients. The results of a regression analysis of the relationship between Regional and national water-use coefficients indicated that the major influence of Regional factors is on the withdrawal coefficients. Water requirements for the household sector were developed using withdrawal and depletion coefficients in units of gallons per capita per year (gpcy). The population of a subregion within the hydrologic boundary was multiplied by the household sector coefficients for that subregion to determine the requirements. For example, the 1965 population of the Upper Main Stem hydrologic subregion was 136, 725, the household withdrawal coefficient was 51,465 (gpcy), and the household depletion coefficient was 18,780 gpcy. This equals 7,036.5 MG and 2.567.7 MG as the 1965 withdrawal and depletion requirements, respectively. Water-use coefficients for the household sector represent a weighted average of municipal-domestic and rural-domestic, including Indian water-use rates. To derive the household water-use rates the following steps were taken: 1. De'-^lop Municipal-Domestic Water-Use Rate. A weighted average municipal water-use rate, which includes all uses served by municipal systems, was developed for each subregion for 1965 from several data sources. 1/ The municipal-domestic withdrawal water-use rate was estimated to be 70 percent of the municipal withdrawal water-use rate in each subregion in 1965. 2/ For example, the municipal- domestic water-use rate in the Upper Main Stem Subregion for 1965 was 70 percent of 243 gpcd, or 170 gpcd. Further, it was estimated that this percentage would remain the same in the Green River Subregion and would decrease in the Upper Main Stem and San Juan-Colorado Subregions in the future target years. A projected weighted average municipal water-use rate was developed for each subregion for the future target years using reasoned judgment and consideration of county urbanization. 1/ References: 10, 11, 12, 19, 29, 36, 40. 2/ References: 23, 41. Data in these references indicate that the municipal- domestic water-use rate ranges between 60 and 75 percent of the municipal water-use rate. 50 |