| OCR Text |
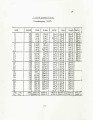
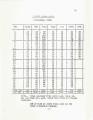
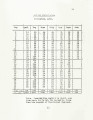
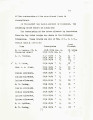
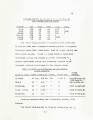
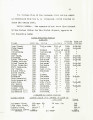
Show 03 Hydro graphs Ao a. 2, 3, 4 and 5 accompanying this report shov< the daily discharge of Ldho Ao£z I'.ivnr for tha irrigation seasons of 1916, 1917, 1913 and 1919 reap aotively. rIhe daily di aohargea for the Uintah Kivsr for tha irrigation season of 1913 and 1919 ars shown by Hydrographs Has. 6 or. d7, "a hi Is hydro graphs ifos. 3 snd 9 present the Sim e data for the Vihi tarooks HAver, andKos. 10 and 11, tho same data for tho 2uchesna hiver. All tho streams are subject to river diurnal fluctuation, as ia evidenced by hydrograph Uo. 12, which i3 a copy of the aclraal .gags reword of tha T/hit erodes Biver from 12:00 2*2*. Hay 23, to 12:00 2. I_. May 01, 19IX). fortunately the river discharge follows oloaoly the demand on the part of the irrigators, that Is W sayr that the flow is light in April ajud iiay and roaches a peak about Jun» 20, and about thia date, tho streams begin to sibaide and carry less and less water until the coming of the fall rains in September. <2he following tabulation gives the maximum, adonisram and average daily flow for August for eleven years, far the Luico Fori, Uintah and v/hi torooks Hi vers: A7.3A0S DULY UI .'_0Lf.a.a ... ii *u -/ u A » (In second feet) Aarc. Average .Minimum Lsk s Jfo__k HiveT, 624 206 127 Uintah Biver, 494 251 152 7/hi tare oka -*iver, 249 110 52 |