OCR Text |
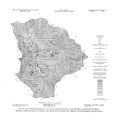
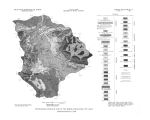
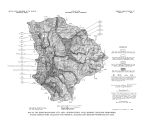
Show So the contribution to recharge, in acre- feet, from irrigation is: Water diverted for irrigation 87,000 Plus precipitation + 12,000 Total: 99,000 Less crop water requirements - 43,000 Difference ( available for recharge): 56,000 And the contribution from subsurface inflow, in acre- feet, is: Total recharge 86,000 Less recharge from irrigation - 56,000 Difference ( recharge from subsurface inflow): 30,000 Movement- The direction of ground- water movement through the unconsolidated deposits in Heber Valley is shown by the water- table map ( fig. 10). In general, the direction of movement is toward the Provo River and downvalley. During periods of peak stream discharge, the direction of movement in the immediate vicinity of the river probably would be reversed. The water- table map indicates that Snake Creek, like the Provo River, is generally a gaining stream in Heber Valley. The three tributaries from the east ( Lake, Center, and Daniels Creeks), however, are losing streams. The coarse- grained fan deposits across which these streams flow as they enter the valley are at altitudes well above the main valley floor, and the water table is several tens of feet below the surface of the fans ( fig. 11). The increased depth to water in the area of these alluvial fans reflects the higher altitude of the land surface; the slope of the water table beneath the fans is about the same as the slope of the water table elsewhere in the valley ( fig. 10). Water- level fluctuations.- The water level in wells in Heber Valley fluctuates in response to the seasonal recharge- discharge cycle ( figs. 11 and 12 and table 7). Generally the water table is highest in late May or early June and gradually declines through the summer, fall, and winter. The lowest level of the year is commonly reached in February or March, shortly before the spring thaw. With the coming of the thaw and the heavy spring runoff, the water table rises rapidly, and again reaches a high in May or June. This seasonal rise and fall of the water level is illustrated by the graph of well ( D- 4- 4) 14abb- 1 ( fig. 12). Man's activities have somewhat altered the cycle in Heber Valley. One effect is the intermittent addition of recharge by irrigation during the growing season. In well ( D- 4- 4) 23bcc- 1 ( fig. 13), the smooth summer decline of the water level is interrupted by many small but rapid rises, each resulting from the rapid infiltration of irrigation water applied to nearby fields. A second effect of man's activities is shown by the same graph- near Deer Creek Reservoir the water level in the aquifer is controlled by the water level in the reservoir ( fig. 13). Except for the minor fluctuations from irrigation during the growing season, the graph of the water level in the well is a subdued image of the graph of the water level in the reservoir. Comparison of the long- term graphs with the graph of departure from normal precipitation at Heber ( fig. 12) shows that the aquifer is in a state of equilibrium, with recharge 29 |