OCR Text |
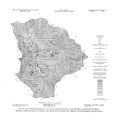
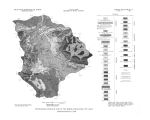
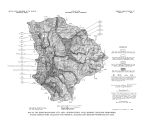
Show ILLUSTRATIONS Page Frontispiece. Heber Valley - View looking northeastward from a spur of the Wasatch Range Plate 1. Map of the Heber- Kamas- Park City area showing locations of wells, springs, stream- gaging stations, and weather stations and normal May- September precipitation In pocket Plate 2. Generalized geologic map of the Heber- Kamas- Park City area In pocket Plate 3. Map of the Heber- Kamas- Park City area showing locations from which water samples were collected for chemical analysis and selected water- quality data In pocket Figure 1. Map showing the location of the Heber- Kamas- Park City area 4 Figure 2. Map of part of the Provo River drainage system 6 Figure 3. Graphs of the discharge of the Provo River below Creek Dam and water storage in Deer Creek Reservoir 10 Figure 4. Graphs of the diversions into and out of the upper Provo River drainage basin ... 11 Figure 5. Map of part of the Weber River drainage system , ... 14 Figure 6. Graphs of the discharge of the Weber River below Wanship Dam and water storage in Rockport Reservoir 16 Figure 7. Photograph showing water discharging from the Spiro Tunnel near Park City . . . 22 Figure 8. Photograph of typical hot pot near Midway 22 Figure 9. Diagrams illustrating differences in quality of water from various sources in the consolidated rocks 24 Figure 10. Map of Heber Valley showing water- level contours in September 1967 30 Figure 11. Maps of Heber Valley showing depths to water in January 1967 ( near seasonal low) and June 1967 ( near seasonal high) 31 Figure 12. Graphs of water levels in selected wells in Heber Valley and cumulative departure from the 1931- 60 normal annual precipitation at Heber 32 Figure 13. Graphs of water levels in well ( D- 4- 4) 23bcc- 1, near the south end of Heber Valley, and water stage in Deer Creek Reservoir 33 Figure 14. Photographs showing the valley fill at the south end of Rhodes Valley exposed by entrenchment of the Provo River 36 III |