| OCR Text |
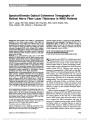
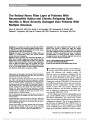
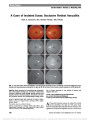
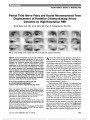
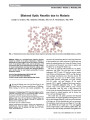
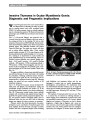
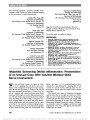
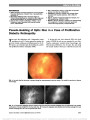
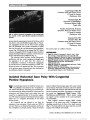
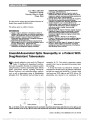
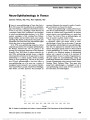
Show A Prospective Photographic Study of the Ocular Fundus in Obstructive Sleep Apnea Clare L. Fraser, MBBS, FRANZCO, Donald L. Bliwise, PhD, Nancy J. Newman, MD, Cédric Lamirel, MD, Nancy A. Collop, MD, David B. Rye, MD, PhD, Lynn Marie Trotti, MD, MS, Valérie Biousse, MD, Beau B. Bruce, MD, MS Background: The prevalence of optic nerve and retinal vascular changes within the obstructive sleep apnea (OSA) population are not well-known, although it has been postulated that optic nerve ischemic changes and findings related to an elevated intracranial pressure may be more common in OSA patients. We prospectively evaluated the ocular fundus in unselected patients undergoing overnight diagnostic polysomnography (PSG). Methods: Demographic data, medical/ocular history, and nonmydriatic fundus photographs were prospectively col-lected in patients undergoing PSG at our institution and reviewed for the presence of optic disc edema for which our study was appropriately powered a priori. Retinal vascular changes were also evaluated. OSA was defined using the measures of both sleep-disordered breathing and hypoxia. Results: Of 250 patients evaluated in the sleep center, fundus photographs were performed on 215 patients, among whom 127 patients (59%) had an apnea/hypopnea index (AHI) $15 events per hour, including 36 with severe OSA. Those with AHI ,15 served as the comparison group. None of the patients had optic disc edema (95% confidence interval [CI]: 0%-3%). There was no difference in rates of glaucomatous appearance or pallor of the optic disc among the groups. Retinal arteriolar changes were more common in severe OSA patients (odds ratio: 1.09 per 5 unit increase in AHI; 95% CI, 1.02-1.16; P = 0.01), even after controlling for mean arterial blood pressure. Conclusions: We did not find an increased prevalence of optic disc edema or other optic neuropathies in our OSA population. However, retinal vascular changes were more common in patients with severe OSA, independent of blood pressure. Journal of Neuro-Ophthalmology 2013;33:241-246 doi: 10.1097/WNO.0b013e318290194f © 2013 by North American Neuro-Ophthalmology Society Obstructive sleep apnea (OSA) is a condition consisting of intermittent upper airway obstruction during sleep, leading to periods of hypoxia, hypercapnia, and acute hyper-tension (1). It has been hypothesized that in OSA, physio-logical changes secondary to hypoxia can result in retinal ischemia and associated retinal vascular changes (2) and progression of glaucomatous damage to the optic nerve (3). In one large, recently published evaluation of billing records (4), an increased risk of nonarteritic anterior ische-mic optic neuropathy (NAION) and idiopathic intracranial hypertension (IIH) was reported in patients with untreated OSA, leading the authors to conclude that OSA patients should undergo ophthalmologic screening (4). Their find-ings mirror another study, which concluded that early screening for potentially blinding optic neuropathies in patients with moderate to severe OSA is worthwhile from an economic standpoint (5). However, the risk for various ocular disorders among patients with OSA remains unclear, particularly because in prior studies, the retinal assessment was performed remote from the time of poly-somnography (PSG) (up to 3 years), and optic disc appear-ance was not assessed (2). Additionally, these studies did not adequately control for potential confounders of these associ-ations, such as obesity and hypertension. Our primary aim Departments of Ophthalmology (CLF, NJN, VB, BBB), Neurology (DLB, NJN, DBR, LMT, VB, BBB), Neurological Surgery (NJN), and Medicine (NAC), Emory University School of Medicine, Atlanta, Georgia; Department of Epidemiology (BBB), Rollins School of Public Health and Laney Graduate School, Emory University, Atlanta, Georgia; and Department of ophthalmology (CL), Fondation Ophtalmologi-que Adolphe de Rothschild and Hôpital Bichat- Claude Bernard, Paris, France. Supported in part by an unrestricted departmental grant (Depart-ment of Ophthalmology) from the Research to Prevent Blindness, Inc, New York, NY, and by the National Institutes of Health/National Eye Institute (NIH/NEI) core grant (P30-EY06360) (Department of Ophthalmology). Dr Bruce received research support from the NIH/ NEI (K23-EY019341). Dr. Newman is a recipient of the Research to Prevent Blindness Lew R. Wasserman Merit Award. Dr. Fraser received the RANZCO Eye Foundation Scholarship and the Sydney Eye Alumni Travelling Fellowship Grant. Other authors have no relevant financial disclosures. The authors report no conflicts of interest. Address correspondence to Valérie Biousse, MD, Emory Eye Center, Neuro-Ophthalmology Unit, 1365 Clifton Road NE, Atlanta, GA 30322; E-mail: vbiouss@emory.edu Fraser et al: J Neuro-Ophthalmol 2013; 33: 241-246 241 Original Contribution Copyright © North American Neuro-Ophthalmology Society. Unauthorized reproduction of this article is prohibited. was to prospectively examine for optic disc edema among OSA patients at the same time as routine diagnostic PSG. Our secondary aim was to evaluate other optic disc, retinal, or vascular changes at the posterior pole of OSA patients recruited prospectively. METHODS Adult patients presenting to our Sleep Center for diagnostic PSG between July and December 2011 were eligible. Patients with known condition other than OSA that could cause raised intracranial pressure (ICP) were excluded. Informed consent was obtained. The study was approved by the Emory Univer-sity Institutional Review Board and followed the tenants of the Declaration of Helsinki. An a priori sample size was calculated for the frequency of optic disc edema, our primary outcome, in order to set the precision of our estimate. Our sample size was based on exact 95% binomial confidence intervals (CIs) to produce an upper bound of no more than 3%, if no optic disc edema was found among the OSA patients, and a margin of error of less than 6% even if up to 10% of OSA patients had optic disc edema. Enrollment of at least 122 patients with OSA was required to achieve this level of precision. Demographics Demographic details including age, sex, ethnicity, and body mass index (BMI) were recorded. A review of ocular and medical history, including previously diagnosed hyperten-sion and measurement of blood pressure, was conducted. Polysomnography All patients underwent conventional, laboratory-based, over-night PSG with monitoring of electroencephalography, electrooculography, surface electromyography, and electro-cardiography. Breathing was measured with separate channels for oral/nasal airflow, nasal pressure, thoracic and abdominal respiratory effort, and pulse oximetry. All recordings were made using Embla N7000 digital PSG using Remlogic software (Denver, CO), and they were scored by Registered Polysomnographic Technologists (6) and reviewed by sleep medicine certified specialists who were unaware of the results of ocular fundus evaluation. Apneas were scored as .90% reduction in respiratory airflow for at least 10 sec-onds. Hypopneas were defined as a diminution in airflow of at least 50% from the preceding baseline accompanied by at least 4% fall in oxygen saturation. The total number of apneas and hypopneas were summed and divided by the total sleep time in hours and multiplied by 60 to yield an apnea/hypopnea index (AHI), as a rate per hour of sleep. We also defined hypoxic burden as the percentage of the sleep time in which the pulse oximetry decreased below 90%. Using these definitions for breathing events, we defined the presence of sleep apnea as an AHI of $15 events per hour. Individuals exceeding this threshold were compared to those with AHI,15 as an initial comparison. We then performed subgroup analyses in which individuals with severe sleep apnea (AHI $ 20 and hypoxic burden $ 10%) were compared with a subgroup with minimal AHI (,5) and minimal burden (,2%). For individuals under-going split night studies (studies in which the first part of the night was done at baseline and the second part to per-form continuous positive airway pressure titration), we used PSG data from only the diagnostic portion of the recording to generate these values. Fundus Photography Photographs centered at the optic disc and macula, from each eye, were obtained by an ophthalmologist, using a commer-cially available tabletop nonmydriatic ocular fundus camera (Kowa Nonmyd a-D III; Kowa Optimed, Inc, Torrance, CA). All included patients had photographs taken on both eyes when they arrived at the sleep center around 8 PM. Two neuro-ophthalmology-trained investigators system-atically reviewed the photographs of each eye for an a priori agreed upon set of findings, without the knowledge of the PSG results. The eye with the highest quality image (7) was used for the measurements of continuous variables (fractal analysis, cup-to-disc ratio); if both were of the same quality, the image from the right eye was used. In cases of asym-metrical findings (i.e., disc edema or retinal findings), the most abnormal eye was chosen for analysis. In cases of asymmetrical disc cupping, a label of glaucoma suspect was given. The disc appearances for each patient were assessed for edema, pallor, and glaucomatous changes (i.e., increased cup-to-disc ratio, focal neuroretinal rim notch-ing). Retinal vascular changes for each patient were classified according to the classification of hypertensive changes (8) with "mild retinopathy" consisting of arteriolar narrowing, arteriolar sclerosis, arteriovenous nicking, "moderate reti-nopathy" including retinal nerve fiber layer (RNFL) hem-orrhages, exudate or cotton wool spots, and "malignant" including associated disc swelling. In the case of disagree-ment regarding any of these findings, a third neuro-oph-thalmologist made the determination of whether an abnormality was present or absent. Any other ocular abnor-malities were also recorded. Patients with poor quality fun-dus photographs were excluded. Fractal Analysis The best fundus photograph from one eye was chosen for each patient and analyzed with ImageJ (National Institutes of Health, Bethesda, MD). An automated approach was used to extract the retinal vessels (Fig. 1). Specifically, we measured the fractal dimension and lacunarity of the retinal vasculature using the box-counting method (FracLac, Charles Sturt Uni-versity, Australia), an established method of measuring struc-tures that are not perfectly self-similar (9). 242 Fraser et al: J Neuro-Ophthalmol 2013; 33: 241-246 Original Contribution Copyright © North American Neuro-Ophthalmology Society. Unauthorized reproduction of this article is prohibited. Statistical Analysis The groups were compared using Wilcoxon rank sum test for continuous data, Fisher exact test for categorical data, and Mantel-Haenszel x2 test for stratified categorical data. Linear regression was used to evaluate the relationship between continuous variables and AHI. Logistic regression was used to evaluate and control for potential confounding (using a 10% change in coefficient rule) by age, race, and BMI on the association between OSA and retinal vascular changes. Significance was set at the 0.05 level. RESULTS Two hundred fifty patients presented for overnight sleep studies when digital fundus photography was available. Of the 250 patients, 215 were enrolled (excluded: 15 refused, 5 unable to consent, 3 photographs of poor quality, and 2 craniosynostosis with possible increased ICP). There were no other exclusions; in particular, no patients had been referred for sleep studies during this period with a possible diagnosis of IIH or NAION. One hundred twenty-seven patients (59%) had OSA, based on AHI $15. Among those patients with an AHI ,15, diagnoses were subclinical sleep-disordered breath-ing (n = 52), primary snoring (n = 16), periodic leg movement disorder (n = 12), physiologic hypersomnolence (n = 4), repetitive intrusions of sleep (n = 1), and normal (n = 1). Relative to the comparison group, OSA patients were older, more likely to be men, had a higher BMI, and were more likely to have a previous diagnosis of hypertension (Table 1). There was no difference in the measured mean systolic blood pressure and mean arterial blood pressure (MAP) comparing OSA patients relative to the comparison group, but severe OSA patients (AHI $ 20; hypoxic burden $ 10%) had higher mean blood pressures when compared to the minimal AHI/minimal hypoxic burden group (AHI , 5; burden , 2%) patients. There were no differences comparing race or frequency of diagnosed dia-betes mellitus. No patient had an optic disc appearance suspicious for optic disc edema. There were no differences in glaucomatous optic disc appearances between OSA and the comparison group (5% vs 2%; P = 0.84; odds ratio [OR] = 1.46; 95% CI, 0.32-6.75 controlling for age, race, sex, hypertension, and diabetes; logistic regression), and the rates of clinical diagnosis of glaucoma or glaucoma suspect were equal between the 2 groups. The rates of sectoral disc pallor were low and equal between the groups. There were more retinal vascular changes, similar to those seen in mild hypertensive retinopathy (9), in severe OSA patients vs minimal AHI/minimal hypoxic burden patients (Fig. 2). These arteriolar changes remained more common in severe OSA patients even after controlling for the history of diagnosed hypertension: (hypertensive severe OSA vs hypertensive minimal AHI/minimal hypoxic burden: 33 vs 8%; nonhypertensive severe OSA vs nonhypertensive mini-mal AHI/minimal hypoxic burden: 28 vs 9%; P = 0.04). AHI remained an independent predictor of retinal arteriolar changes (OR, 1.09 per 5 unit increase in AHI; 95% CI, 1.02-1.16; P = 0.01) even after controlling for measured MAP (OR, 1.99 per 10 mm Hg increase; 95% CI, 1.38- 2.88; P = 0.0003). For example, for any given blood pressure, an AHI .40 conferred a doubling of the odds of retinal vascular changes being seen, compared to a patient with AHI ,5. These relationships were not confounded by age, race, or BMI based on multivariable logistic regression. None of the comparison group had RNFL hemorrhages compared to 4% of the OSA patients (P = 0.08), which would be classified as moderate hypertensive changes. Of these 5 patients, one had known diabetes with hypertension, 2 had a diagnosis of hypertension, and 2 had neither. Fractal analysis of the retinal vascular tree found no differences in any measure of fractal dimension or lacunarity between the OSA patients and the comparison group (P = 0.16; Table 1; Fig. 1). DISCUSSION We evaluated 215 patients undergoing PSG, 127 with OSA, in what is, to our knowledge, the largest systematic FIG. 1. Fundus photograph of a patient with obstructive sleep apnea obtained during the study (A) with extraction of the retinal vessels for fractal analysis (B). Fraser et al: J Neuro-Ophthalmol 2013; 33: 241-246 243 Original Contribution Copyright © North American Neuro-Ophthalmology Society. Unauthorized reproduction of this article is prohibited. investigation of the ocular fundus findings of OSA patients on the night of PSG. Episodic ICP elevations occur during apneic episodes of the OSA patients (10). In addition, hypercapnia can alter cerebral vascular reactivity, causing an increased ICP with the potential for associated optic disc edema (11,12). Hypoxia can also occur during apneic episodes, and subjects with hyp-oxia at high altitude have been shown on fundus photography to develop disc edema, markedly tortuous retinal vasculature, and preretinal hemorrhages (13). Of 41 OSA patients exam-ined in one study (5), 2 were found to have "disc swelling," but no further comment was made about these patients because the study was designed to screen for glaucoma. Another study examined 35 OSA patients and found no optic disc edema (14). Similar to this latter study, we found no optic disc edema in our 127 OSA patients (0%; 95% CI, 0%-3%). TABLE 1. Comparison of the demographics, medical and ocular history, and ocular fundus photography findings among patients evaluated for obstructive sleep apnea Overall Comparison Subset Analysis OSA* (n = 127) Comparison† (n = 88) P Severe OSA‡ (n = 36) Minimal burden§ (n = 46) P Apnea-hypoxia index (±SD) 37 (±29) 4.7 (±4.4) ,0.001 57 (±31) 1.2 (±1.1) ,0.001 Hypoxic burden, % (±SD) 13 (±20) 1.9 (±9.6) ,0.001 32 (±26) 0.2 (±0.4) ,0.001 Age, years (±SD) 60 (±12) 52 (±16) 0.01 60 (±12) 50 (±16) 0.18 Sex 62% men 40% men 0.001 58% men 24% men 0.002 Race 59% white 60% white 0.61 39% white 54% white 0.23 Body mass index, kg/m2 (±SD) 32 (±8) 28 (±8) ,0.001 36 (±9) 28 (±6) ,0.001 Hypertension 49% (62) 28% (25) ,0.001 50% (18) 26% (12) 0.02 Systolic blood pressure, mm Hg (±SD) 134 (±16) 131 (±15) 0.24 138 (±18) 128 (±15) 0.01 Mean arterial blood pressure, mm Hg (±SD) 96.5 (±11) 95.7 (±11) 0.68 99.6 (±12) 93.6 (±10) 0.02 Diabetes mellitus 17% (21) 17% (15) 0.92 19% (7) 20% (9) 0.99 Optic disc edema 0% (0) 0% (0) 1.0 0% (0) 0% (0) 1.0 Glaucomatous discs 5% (6) 2% (2) 0.84 13% (5) 5% (2) 0.85 Diagnosis glaucoma 3% (4) 3% (3) 1.0 8% (3) 4% (2) 0.65 Glaucoma suspect 2% (2) 1% (1) 1.0 6% (2) 0% (0) 0.44 Sectoral pallor 2% (2) 1% (1) 1.0 6% (2) 0% (0) 0.19 Retinal vascular changes 17% (21) 10% (9) 0.19 31% (11) 9% (4) 0.01 RNFL hemorrhages 4% (5) 0% (0) 0.08 6% (2) 0% (0) 0.19 Fractal dimension 1.46 1.48 0.16 1.47 1.49 0.17 Lacunarity 0.0014 0.0012 0.42 0.0016 0.0012 0.17 *OSA defined as AHI $ 15. †Comparison defined as AHI , 15. ‡Severe OSA defined as AHI $ 20 and hypoxic burden (cumulative time with SaO2 , 90%) $ 10% of recording. §Minimal burden: defined as AHI , 5 and hypoxic burden (cumulative time with SaO2 , 90%) , 2% of recording. RNFL, retinal nerve fibre layer. FIG. 2. Fundus photography of a patient with obstructive sleep apnea. A. Arteriovenous nicking (arrow) and focal arteriolar narrowing (arrowheads). B. Arteriolar sclerosis and narrowing (arrow). C. Arteriolar narrowing (arrow). 244 Fraser et al: J Neuro-Ophthalmol 2013; 33: 241-246 Original Contribution Copyright © North American Neuro-Ophthalmology Society. Unauthorized reproduction of this article is prohibited. Other optic neuropathies have been associated with OSA. In the case of glaucoma, the findings have been contradictory, with one study showing no difference (15) and another reporting rates nearly 4 times higher than the expected population rate of 2% (3). Studies of NAION patients have found that 71%-89% have OSA by diagnos-tic PSG compared to 18% of controls (16), but whether the association between OSA and NAION is only because of confounding by shared risk factors for both conditions (e.g., age) or truly represents a causal relationship between OSA and NAION remains unknown. In our study, we found no differences between the optic disc appearance of patients with OSA compared to those without OSA, and we found no differences in the frequency of disc pallor or diagnosed glaucoma between the 2 groups. The only difference we demonstrated was that retinal vascular changes, similar to those seen in mild hypertensive retinopathy, were over 3 times more common in severe OSA patients than in the minimal AHI/minimal hypoxic burden patients, even after controlling for diagnosed hypertension. The odds of retinal vascular changes also increased with increasing AHI, even when controlling for the patients' measured blood pressure, age, race, and BMI. Previous fundus photographic studies have shown that ret-inal vascular changes are associated with hypertension (17) but not sleep-disordered breathing (2). Therefore, one potential explanation for our observations is that the vascu-lar changes are caused by elevated blood pressure and are exacerbated by the presence of OSA. However, the changes seen could instead be the result of the OSA and exacerbated by hypertension. As in any observational study, residual confounding from the use of a single blood pressure mea-surement or from unknown or unmeasured confounders could also explain our results. Selection bias is also a concern because it is likely that hypertension and its comorbidities play a role in which patients are referred for sleep studies. Various human studies have shown that retinal, but not choroidal, blood flow is affected by hypercapnia (18,19), and oxygen saturation does not affect the flow in either ocular circulation (19). However, if OSA causes chronic physiological changes in blood flow, this may lead, over time, to the visible arteriolar changes we documented on fundus photography, independent of elevated blood pres-sure. Indeed, OSA has been shown to be an independent risk factor for other conditions associated with vascular changes, such as stroke, heart disease (20), and impaired renal function (21). Vascular endothelial dysfunction has been documented in OSA patients, which is independent from hypertension (22). The arteriolar changes we found on fundus photography may be a visible evidence of the end organ damage produced by OSA. Fractal analysis is used in the spatial analysis of branching patterns in biological systems (23), including cardiovascular disease (24) and the retinal vasculature in patients with hypertension (6). However, our fractal analy-sis failed to show any of the subclinical changes in the overall branching patterns of the retinal vasculature that have been described in larger studies of hypertensive reti-nopathy (8,24). We acknowledge that our study may be relatively underpowered for this outcome, particularly for detecting subtle differences in retinal fractal analysis. In conclusion, our study showed that arteriolar changes are more common in severe OSA patients than in those with no OSA. We did not find evidence of differences in the prevalence of glaucomatous changes or optic disc edema. Our results do not support the routine ophthalmo-scopic screening of OSA patients for optic neuropathies. However, if our finding of retinal arteriolar changes as an independent association with OSA is confirmed, evaluation of the retinal vasculature may help inform future studies of the pathophysiology of end organ damage in OSA. REFERENCES 1. Kiekens S, Veva De G, Coeckelbergh T, Tassignon MJ, van de Heyning P, Wilfried De B, Verbraecken J. Continuous positive airway pressure therapy is associated with an increase in intraocular pressure in obstructive sleep apnea. Invest Ophthalmol Vis Sci. 2008;49:934-940. 2. Boland LL, Shahar E, Wong TY, Klein R, Punjabi N, Robbins JA, Newman AB. Sleep-disordered breathing is not associated with the presence of retinal microvascular abnormalities: the Sleep Heart Health Study. Sleep. 2004;27:467-473. 3. Mojon DS, Hess CW, Goldblum D, Fleischhauer J, Koerner F, Bassetti C, Mathis J. High prevalence of glaucoma in patients with sleep apnea syndrome. Ophthalmology. 1999;106:1009-1012. 4. Stein JD, Kim DS, Mundy KM, Talwar N, Nan B, Chervin RD, Musch DC. The association between glaucomatous and other causes of optic neuropathy and sleep apnea. Am J Ophthalmol. 2011;152:989-998 e983. 5. Tsang CS, Chong SL, Ho CK, Li MF. Moderate to severe obstructive sleep apnoea patients is associated with a higher incidence of visual field defect. Eye. 2006;20:38-42. 6. Iber C, Ancoli-Israel S, Chesson A, Quan S. The ASSM Manual for the Scoring of Sleep and Associated Events. Westchester, IL: American Academy of Sleep Medicine, 2007. 7. Bruce BB, Lamirel C, Wright DW, Ward A, Heilpern KL, Biousse V, Newman NJ. Nonmydriatic ocular fundus photography in the emergency department. N Engl J Med. 2011;364:387-389. 8. Wong TY, Mitchell P. Hypertensive retinopathy. N Engl J Med. 2004;351:2310-2317. 9. Liew G, Wang JJ, Cheung N, Zhang YP, Hsu W, Lee ML, Mitchell P, Tikellis G, Taylor B, Wong TY. The retinal vasculature as a fractal: methodology, reliability, and relationship to blood pressure. Ophthalmology. 2008;115:1951-1956. 10. Sugita Y, Iijima S, Teshima Y, Shimizu T, Nishimura N, Tsutsumi T, Hayashi H, Kaneda H, Hishikawa Y. Marked episodic elevation of cerebrospinal fluid pressure during nocturnal sleep in patients with sleep apnea hypersomnia syndrome. Electroencephalogr Clin Neurophysiol. 1985;60:214-219. 11. Purvin VA, Kawasaki A, Yee RD. Papilledema and obstructive sleep apnea syndrome. Arch Ophthalmol. 2000;118:1626- 1630. 12. Lim MJ, Lin JP. The effects of carbon dioxide on measuring cerebral spinal fluid pressure. Childs Nerv Syst. 2009;25:783- 784. 13. Frayser R, Houston CS, Bryan AC, Rennie ID, Gray G. Retinal hemorrhage at high altitude. N Engl J Med. 1970;282:1183- 1184. 14. Peter L, Jacob M, Krolak-Salmon P, Petitjean T, Bastuji H, Grange JD, Vighetto A. Prevalence of papilloedema in patients Fraser et al: J Neuro-Ophthalmol 2013; 33: 241-246 245 Original Contribution Copyright © North American Neuro-Ophthalmology Society. Unauthorized reproduction of this article is prohibited. with sleep apnoea syndrome: a prospective study. J Sleep Res. 2007;16:313-318. 15. Geyer O, Cohen N, Segev E, Rath EZ, Melamud L, Peled R, Lavie P. The prevalence of glaucoma in patients with sleep apnea syndrome: same as in the general population. Am J Ophthalmol. 2003;136:1093-1096. 16. Palombi K, Renard E, Levy P, Chiquet C, Deschaux C, Romanet JP, Pepin JL. Non-arteritic anterior ischaemic optic neuropathy is nearly systematically associated with obstructive sleep apnoea. Br J Ophthalmol. 2006;90: 879-882. 17. Cheung CY, Tay WT, Mitchell P, Wang JJ, Hsu W, Lee ML, Lau QP, Zhu AL, Klein R, Saw SM, Wong TY. Quantitative and qualitative retinal microvascular characteristics and blood pressure. J Hypertens. 2011;29:1380-1391. 18. Roff EJ, Harris A, Chung HS, Hosking SL, Morrison AM, Halter PJ, Kagemann L. Comprehensive assessment of retinal, choroidal and retrobulbar haemodynamics during blood gas perturbation. Graefes Arch Clin Exp Ophthalmol. 1999;237:984-990. 19. Tonini M, Khayi H, Pepin JL, Renard E, Baguet JP, Levy P, Romanet JP, Geiser MH, Chiquet C. Choroidal blood-flow responses to hyperoxia and hypercapnia in men with obstructive sleep apnea. Sleep. 2010;33:811-818. 20. Drager LF, Polotsky VY, Lorenzi-Filho G. Obstructive sleep apnea: an emerging risk factor for atherosclerosis. Chest. 2011;140:534-542. 21. Adeseun GA, Rosas SE. The impact of obstructive sleep apnea on chronic kidney disease. Curr Hypertens Rep. 2010;12:378- 383. 22. Oflaz H, Cuhadaroglu C, Pamukcu B, Meric M, Ece T, Kasikcioglu E, Koylan N. Endothelial function in patients with obstructive sleep apnea syndrome but without hypertension. Respiration. 2006;73:751-756. 23. Masters BR. Fractal analysis of the vascular tree in the human retina. Annu Rev Biomed Eng. 2004;6:427-452. 24. Liew G, Mitchell P, Rochtchina E, Wong TY, Hsu W, Lee ML, Wainwright A, Wang JJ. Fractal analysis of retinal microvasculature and coronary heart disease mortality. Eur Heart J. 2011;32:422-429. 246 Fraser et al: J Neuro-Ophthalmol 2013; 33: 241-246 Original Contribution Copyright © North American Neuro-Ophthalmology Society. Unauthorized reproduction of this article is prohibited. |