| OCR Text |
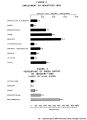
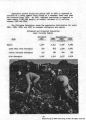
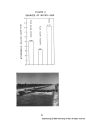
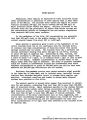
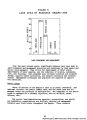
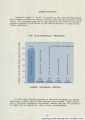
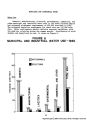
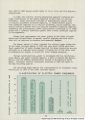
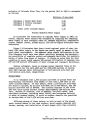
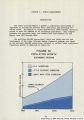
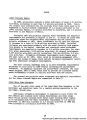
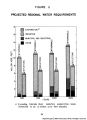
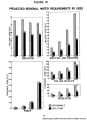
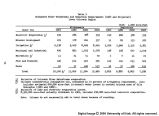
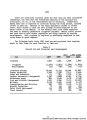
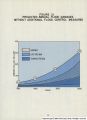
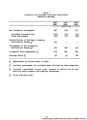
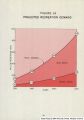
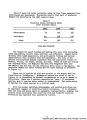
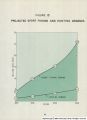
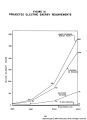
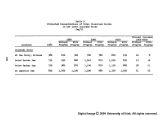
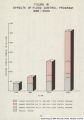
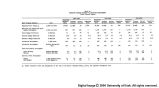
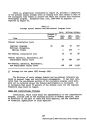
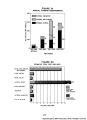
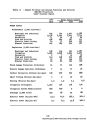
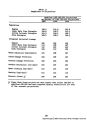
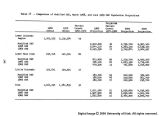
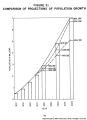
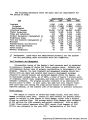
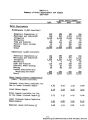
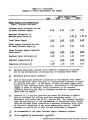
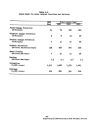
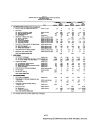
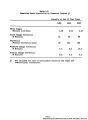
Show Table 11, graphically illustrated in Figure 19, provides a comparison of the present annual average level of funding with that needed in each of the subsequent time frames to achieve the water and related land resources development program. Estimated total cost, 1965-2020 by purposes, is depicted by Figure 20. Table 11 Average Annual Federal and Non-Federal Program Costs ______________________________________________Unit: Million Dollars - Present 1/ Funding 1965- 198l- 2001- Item_____________________________Level______1980 2000 2020 Federal Installation Costs Regional Programs 30 100 97 205 National Obligation, Mexican Treaty - 163 Non-Federal Installation Cost 36 56 86 Federal Operation, Maintenance, and Replacement Annual Costs 66 290 359 Non-Federal Operation, Maintenance, and Replacement Annual Costs 108 5*+8 1,^99 1/ Average for the years 1965 through 1969. The division of costs between Federal and non-Federal interests was based on present legal and institutional arrangements. It has been indi- cated that the non-Federal portion of the recreation program could prob- ably not be achieved unless the Federal participation is increased. It is estimated that about 70 percent of the Federal costs for the regional framework plan would be repaid. Legal and Institutional Problems Constraints, which could delay the implementation of the comprehensive program, include some of the existing policies of Federal agencies, lack of authority on the part of state and local agencies, and the constraint of financial capabilities of local agencies. 132 |