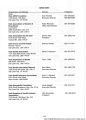
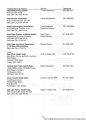
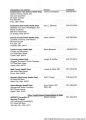
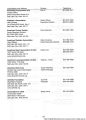
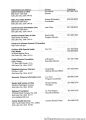
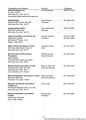
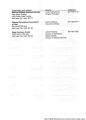
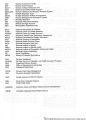
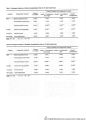
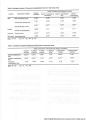
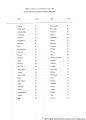
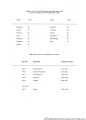
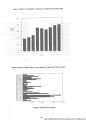
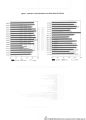
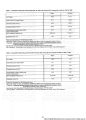
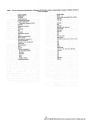
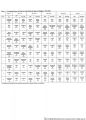
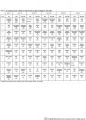
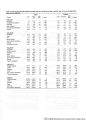
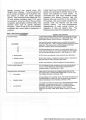
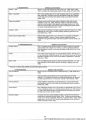
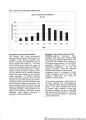
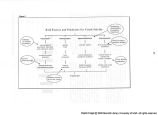
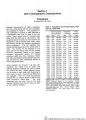
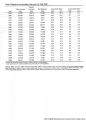
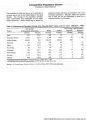
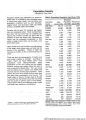
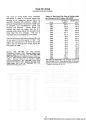
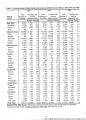
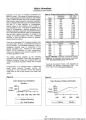
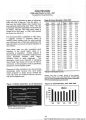
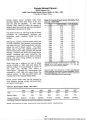
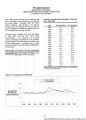
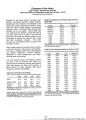
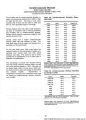
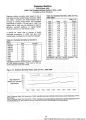
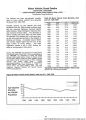
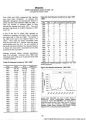
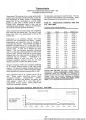
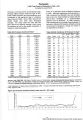
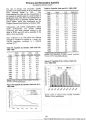
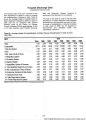
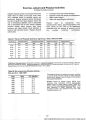
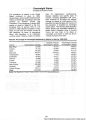
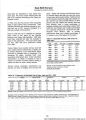
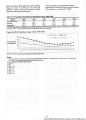
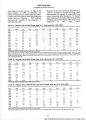
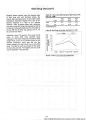
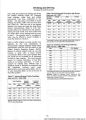
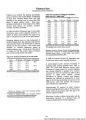
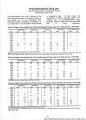
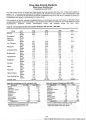
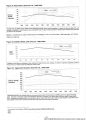
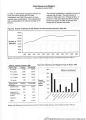
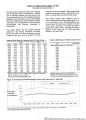
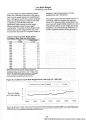
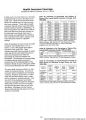
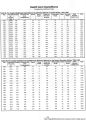
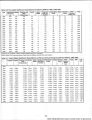
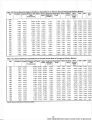
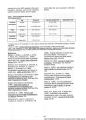
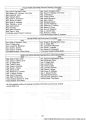
| Show Population by Health District and County Compiled by Heather Bennett With the majority of the population living in urban settings the rural and frontier populations could face challenges in providing access to health care Most of Utahpopulation growth has been in the counties along the Wasatch Front Some of the rural counties have declined in population which could be potentially damaging to small towns in terms of economic stability and health Table Population Changes by Health District and County1 1998 estimate 1 1999 estimate121 083082 502 131 007 128 787 41 732 40927 87 440 86 067835793 64 553 63 923120 7973 11 959 12 029644581 Numeric population change 1998-99 38 551220 805373 a2 630 147 70 63 population change 1998-9997 20 16 230 18 -06 40 21 268 21 408 140 07 Sevise Ways Divie SantLeke Southeastern Caboy 18 621460 229 393 837 860 55 031 21 649 18 884 2538 235 438 843 271 54 905 21422 263 78 6045 5411 126 227 14 32 26 06 02 10 Emepy 109 818 10 862 -56 -05 Grand Sapian Southwest Eledver Gartield on Kane 8895 13 569 125 163963 4482 30 495 6078 060 13 561 129 297881550 31518 6144 165 -8 4134 -82 68023 19 01 33 14 15 341 Washinglon 78415 81 204 789 36 25 669 33 202 39 739 26 459 35 847 40 147 790645 408 31 800 73 737 24 34 14 256 24 770 14 381 25 020 125 259 090 340 303 353 136 12 833 38 13 317 13711 304 30 190 115 193 282 167 17 District County StatwotIkeh Bear River Pox Eldav Cochet Rl Cantral Utah duab Mar Sanpete summit Toosls Untah Basin Daggett Duchesne Qntal Utah County Wasaich Weber-Morgan 4 525 7626 7101 Moxgan 16008 186 020 183 014 Weber Source Utah Health Department Office of Public Health Data Bureau of Vital Records 1999 UtahVital Statistics Births and Deaths 1999 Online www health state ut us 64 Digital image 2005 Marriott Library University of Utah Al rights reserved |