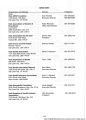
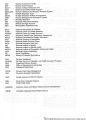
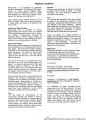
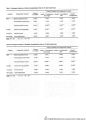
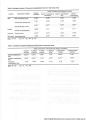
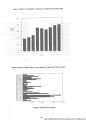
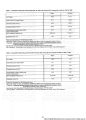
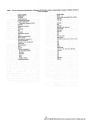
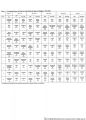
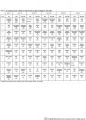
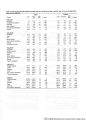
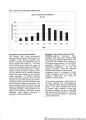
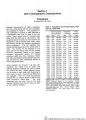
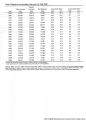
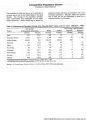
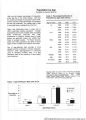
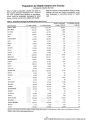
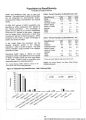
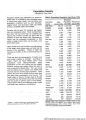
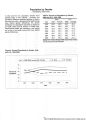
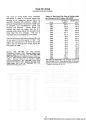
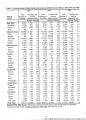
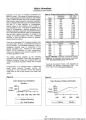
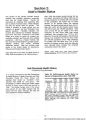
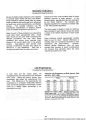
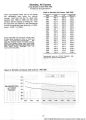
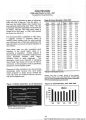
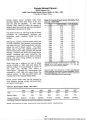
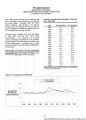
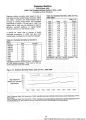
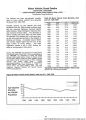
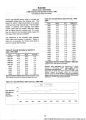
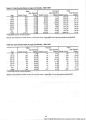
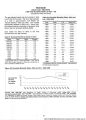
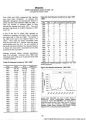
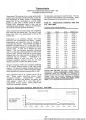
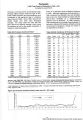
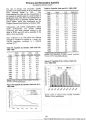
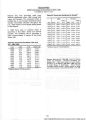
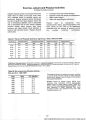
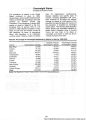
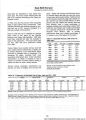
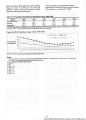
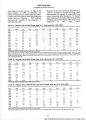
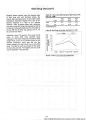
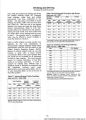
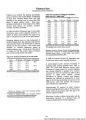
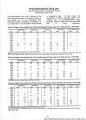
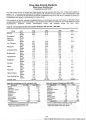
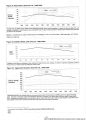
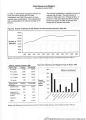
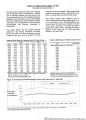
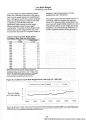
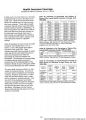
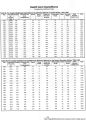
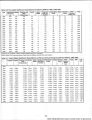
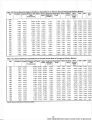
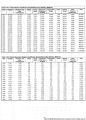
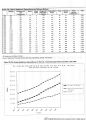
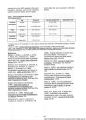
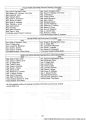
| Show SectionUtahDemographic Characteristics Population Compiled By Tyler Owen Selected characteristics of Utahpopulation and their comparisons with theS population are presented in Table The population in Utah continued to increase in 1999 although atdecelerated rate from its peak in the mid 1990 Utahgrowth rate of9 percent was higher than the 1998 rate of65 percent This population growth is made up of two factors the populationnatural growth total births minus total deaths and the net migration immigration The net migration rate minus emigration change has decreased since the recent peak in 1994 The reasons for net migration in any given year are not always clear but can include economic opportunity quality of life wages education opportunity access to services including health and other amenities Utahbirth rate and relatively young median age 26yrs are still the main contributing factors to Utahhigh growth rates Some problems are inherent in all data sets Therefore the reader must be aware that different statistical methods are used to collect and predict the data Slightly different values can be found for each data point depending on which report is used Usually these differences are negligible There are small discrepancies between theS Census Bureaudata and the The Utah Utah Govemors Office data generated data are used here for the state reported statistics while theS data was used to report national statistics Table Population Size Growth Rates Utah andS 1955-1999 Total Population in thousands Year Utah US Population Total Change Increase Utah US Utah 1955 783 1659314077 33 00059 30 000 1960 900 180 67145 1965 991 194 3033325 13 00017 19 000 1970066 20505281 37 000 1975234 21597309 099 1980474 227 22510 096 58 000 21 000 089 1985643 237 924 129 20 000 092 1986663 240 133 122 15 00089 1987678 242 289 090 12 000 091 1988690 244 449 072 16 000 1989 1706 24681995 09406 23 000 1990729 249 4383507 46 000 1991775 252 127 26613 47 000 1992822 254 995 26507 44 000 1993866 257 746 241 1994916 260 2896898 50 000 43351 095 1995 1959 262 765 226 092 43 049 1996002 265 190 220 096 46 353 1997049 267 744 231 34 485 095 1998083 276 299 165 1999121 272 3309095 38 551 Sources Utah Goverors Office of Planning and Budget 2000 Economic Report to the Goveror Online yoww governor state ut us dea Utah Department of Health Office of Public Health Data Bureau of Vital Records 1999 UtahVital Statistics Births and Deaths 1997 Oniine Census Bureau 1999 wwwhealth state utus US United States 1998 Onine Statistical Abstract the Consus gov 60 Digital image 2005 Marriott Library University of Utah Al rights reserved |