OCR Text |
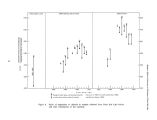
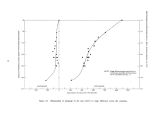
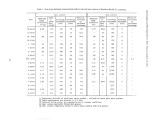
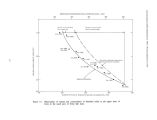
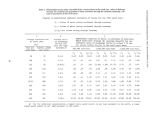
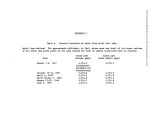
Show Utah Geological and Mineralogical Survey, Water- Resources Bulletin 14, 1970 APPENDIX B COMPUTATIONS OF DISCHARGE AND MOVEMENT OF DISSOLVED SALTS THROUGH THE CAUSEWAY, 1969 WATER YEAR In order to compute the dissolved- solids load moving through the causeway during the 1969 water year, the volume of water moving in each direction was estimated. Then, using the small amount of chemical- quality data available, an average concentration of dissolved solids for that flow was calculated. Finally, from the volume and concentration, the load of dissolved solids was calculated. All the figures used in the following computations are averages or estimates. The results of the computations should be considered as only a general indication of the probable discharge and load movement for the one seasonal lake cycle that was considered. 1. The discharge through the culverts was estimated as follows: the difference in stage across the causeway, as determined from the records of the lake- stage recorders on either side of the causeway, averaged 0.8 feet for the entire year ( table 5). Using this stage difference and the relationship between discharge in the east culvert and the stage difference ( figure 10), the discharge through the east culvert was calculated. A corresponding relationship based on measurements at the west culvert could not be made, because that culvert was plugged with fill during part of the year. Discharge through the west culvert was estimated on the basis of measurements made in the west culvert prior to the time of plugging and comparison of these measurements with measurements of discharge made at the same time in the east culvert. The following figures resulted from these estimates: Average discharge Cubic feet Acre- feet northward per second per year East culvert 500 362,000 West culvert 350 253,000 Total 615,000 Average discharge southward East culvert 75 54,000 West culvert 0 0 Total 54,000 Net discharge northward 560,000 ( Rounded) 2. The discharge through the fill could not be estimated from direct measurements; therefore, it was estimated indirectly. The net inflow to the north part of the lake was estimated by using the following formulas: Total inflow to north part = evaporation ± change in volume - precipitation - ground- water inflow and, because an estimated 15 percent of the inflow to the north part came from other surface inflow ( streams and springs), 85 percent came through the fill. Thus, net inflow to north part through causeway = 85 percent of total inflow. The variables in the formulas were assigned a range of values which represents the possible maximum and minimum values that might have occurred during the 1969 water year. The range in evaporation was estimated to be from 780,000 to 1,560,000 acre- feet, from the following considerations: Peck ( 1954, p. 8) estimated the total average- annual depth of evaporation to be 3.14- 3.80 feet, depending upon salt content of the lake. Dickson and McCullom ( 1965, p. 24) estimated evaporation during the summer of 1963 ( July- September) to be about 4.2 feet. Evaporation for the whole year was probably in excess of 5 feet. The actual evaporation during the 1969 water year is assumed to be somewhere between 3 and 6 feet, and the average area of the water surface of the north part was about 260,000 acres. The range in possible evaporation, therefore, was from 3 x 260,000 to 6 x 260,000 or from 780,000 to 1,560,000 acre- feet. The change in volume during the 1969 water year was obtained by using the beginning and ending stages from the lake- stage recorders and the stage- volume relationships. The volume change in the north part was an increase of 150,000 acre- feet, based on the assumption that the north part contained about 40 percent of the total lake volume at the average lake stage during the year. The average annual precipitation for the north part of the lake is about 8 inches. A possible range of precipitation of 6- 10 inches ( 0.50- 0.83 foot) was assumed for the 1969 water year. The average water- surface area during the year was about 260,000 acres; hence, the estimated range of precipitation was 130,000- 216,000 acre- feet. The north part receives only a small percentage of the total ground- water inflow to the lake. The 37 |