OCR Text |
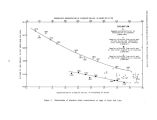
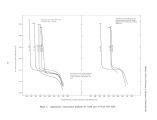
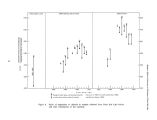
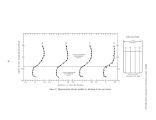
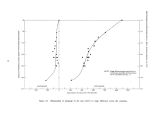
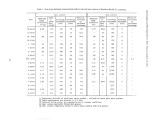
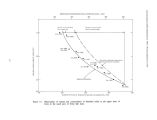
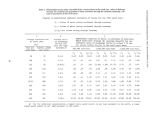
Show Madison- Effects of Causeway on Chemistry of Great Salt Lake Discharge through the Fill The movement of brine from south to north through the approximately 13 miles of newer causeway fill has been visually observed at all times of the year and everywhere along the length of the fill. The less dense water from the south part is readily discernible flowing through the riprap on the north side of the fill and spreading over the surface of the more dense water in the north part. This flow has also been confirmed by density measurements. The actual exit area of the water from the permeable fill material is behind the huge boulders used for riprap, thus the actual thickness of the section through which the water emerges could not be determined. By the time the water has moved out around the riprap into the north part of the lake, it is in a layer that is only an inch to a few inches thick. Discharge northward is not visually discernible through the older sections of causeway fill, and a density difference could not be detected at the surface near the edge of the older fill. Personnel of the Southern Pacific Co. have stated that the older fill at each end of the causeway was constructed of finer grained materials than that used in the new causeway, and that bottom mud was not dredged before placement of the fill. Discharge from north to south through the fill could not be visually observed any place along the causeway. Density profiles ( figure 1) and chemical analyses of samples collected at various depths ( table 6) along the south edge of the causeway showed no evidence of water from the north part entering the south part above the more dense lower layer in the south part. To determine whether or not the brine was actually moving in both directions through the fill as well as the culverts, and to estimate the time of travel through the fill, tracer studies were made at several points along the fill. ( See appendix A for a detailed description of the tracer studies.) The tracer studies, using dye, showed that two- way movement does occur in the fill and that the southward moving water moves out of the fill at or below the level. of the deep layer in the south part. The tracer studies also gave a general idea of the travel time of brine through the fill. A most significant finding obtained from the tracer studies, however, is that the patterns of discharge through the fill are extremely complex. Accurate estimates of the discharge in each direction will require a complex analysis that is beyond the scope of the present investigation. Net Discharge and Load Movement through the Causeway The discharge through the culverts and fill was estimated for the 1969 water year on the basis of methods described in the previous sections. From the estimated discharge and average concentration of dissolved solids, the movement of load of dissolved solids in each direction was calculated for the 1969 water year. ( See appendix B for a detailed description of the computations involved.) The results of these estimates of water and load movement through the causeway are summarized in the following table: Discharge Thousands of northward: acre- feet Culverts 615 Fill Total ( Vi) ( approx.) 720 1,340 Discharge southward: Culverts 54 Fill 281 Total ( V0) ( approx.) 340 Load movement Million tons northward: Culverts 169 Fill 198 Total ( VICI) ( approx.) 37^ Load movement southward: Culverts 25 Fill 132 Total ( V0Co) ( approx.) 160 Net load movement for entire causeway ( VjCi -. V0C0) 210 northward Ratio of discharge ( Vi/ V0): Culverts 11: 1 Fill 3: 1 Average for entire causeway 4: 1 24 |