OCR Text |
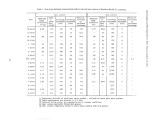
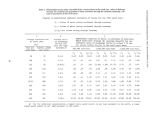
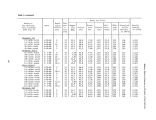
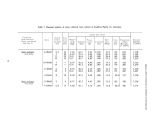
Show Table 1. Data from discharge measurements made in east and west culverts of Southern Pacific Co. causeway. East culvert West culvert Date Measured stage difference ( ft)±/ Depth to interface ( ft) 2/ Discharge northward ( cfs) Discharge southward ( cfs) Ratio of northward to | southward discharge Measured stage difference ( ft) Depth to interface ( ft) Discharge northward ( cfs) Discharge southward ( cfs) Ratio of northward to southward discharge 10- 24- 68 0.82 9.0 424 52 8: 1 0.70 None 450 0 - 11- 15- 68 - 9.5 453 41 11: 1 - do 484 0 ''"-.'•• 12- 5- 68 .82 10.0 503 32 16: 1 .98 do 547 0 - 12- 17- 68 - - - - - - do 378 0 - 1- 7- 69 .68 10.5 438 18 24: 1 .64 do 386 0 - 1- 16- 69 .88 10.5 521 28 19: 1 .65 do 405 0 - 2- 5- 69 .84 10.0 500 43 12: 1 .77 do 550 0 • ••-; 2- 18- 69 .77 10.5 556 42 13: 1 .89 do 584 0 - J/ 3- 4- 69 - 7.0 213 226 0.9: 1 .28 8.0 238 44 5: 1 3- 26- 69 1.16 11.5 684 43 16: 1 1.15 None 706 0 - 4- 23- 69 1.53 None 1,100 0 - 1.56 do 1,010 0 - 5- 13- 69 1.17 12.0 810 40 20: 1 1.13 do 4/ 738 0 - 6- 4- 69 1.12 10.5 627 62 10: 1 1.06 do 4/ 420 0 - 6- 17- 69 1.04 9.5 514 104 5: 1 - - - - - 7- 15- 69 1.03 10.0 614 71 9: 1 1.15 None 4/ 110 0 - 8- 6- 69 - 9.5 504 89 6: 1 - - ( 5/) - - 8- 19- 69 1.05 9.0 508 79 6: 1 - - ( I/) - - 9- 15- 69 • 74 8.5 412 95 4: 1 - - . ( V) - \ J Represents altitude of south part water surface - altitude of north part water surface. 2/ Depth measurements are accurate to 0.5 foot. 3_/ Measured during storm; not representative of average conditions. 4/ West culvert partially filled with gravel. 5/ West culvert completely filled to above water surface with fine gravel. S & to |