| OCR Text |
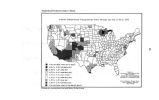
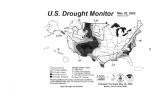
Show 9 like some parts of Northern California do have very severe droughts as indicated there. Beyond the instrumented period, beyond a hundred years or so, climatologists used proxy paleoclimate data from tree rings, lake and dune sediments, and historic and archaeological records. Tree ring data for west- central Utah as shown from the period 1700 to 1978 in Figure 4, that's the top, and it just shows that there are several periods of very severe droughts. These kinds of paleo data can be extended well back into the 10,000- year period and it shows that even more extreme droughts of greater length have occurred in the distant past. Since these extreme long- lasting droughts have occurred in the past, it is reasonable to assume that they may occur in the future as well. Speaking of the future, global climate change is one of the main scientific issues of our time, and the relationship of drought to climate change is a significant issue for this committee. Global climate models show increased greenhouse gases like carbon dioxide and methane will increase the Earth's temperatures in the 21st Century. It will also bring increased precipitation in the high latitudes and less in the low latitudes. Some of these modelers speculate that in between, in the mid- continent regions, droughts may become more frequent and more severe. But at this time the models are not accurate enough to really specify that so we can't be sure whether future droughts in the western United States will be more severe and longer or that they will occur more frequently. Let me turn now to the current drought situation. The next slide- this shows the Palmer Index ending on the 25th of May. You can see that almost all of the southwestern part of the United States is in the brown or yellow shades and the brown shade that's in Southern California- it's a little difficult to see the colors here- indicates that they are in severe drought and certain of the areas are in extreme drought and all the rest of Utah is in at least severe drought. The next slide shows the stream flow and the color pattern is the oranger or redder the more, the lower the stream flow averages. The orange color is less than 50 percent of the average and so almost all the streams in all of Utah are less than 50 percent of the normal stream flow. This is a projection for this coming summer. The next slide and the last slide- this shows the Drought Monitor Map from the National Drought Monitoring Center, where Dr. Hayes and my colleague, the director Dr. Don Willheiser. It also shows the similar picture. Throughout all of the southwestern United States there are droughts that will impact agriculture. The three main categories they are listing here are agriculture, water resources, and fire danger. That concludes my remarks, Mr. Chairman. [ The prepared statement of Dr. Potter follows:] PREPARED STATEMENT OF THOMAS D. POTTER Thank you Mr. Chairman. My name is Tom Potter. I'm a Research Professor in the Department of Meteorology at the University of Utah and Director of the NOAA Cooperative Institute for Regional Prediction. Our institute specializes in mountain meteorology and includes research on predictions at all time scales. For the past seven years, we have concentrated on the development of short- range predictions for the 2002 Winter Olympic Games. I'm very pleased to report that the weather sup- |


