| OCR Text |
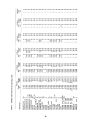
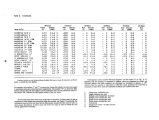
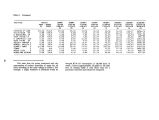
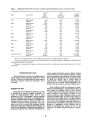
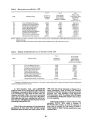
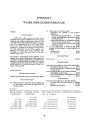
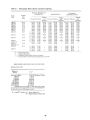
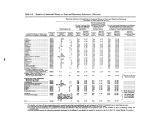
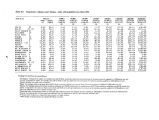
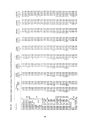
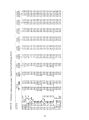
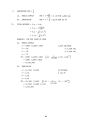
Show Table 17. Fishing and hunting water user fee potentials in Utah. 1975- 1976 Feesa Total Price , Add On Total Sold Elasticity Fee Revenue $ 2.00 Resident Fishing ( 12, under 16) 43,041 - 0.24 8.33 179,266 $ 5.00 Resident Deer ( 16 and over) 82,973 - 0.24 20.83 864,164 $ 2.50 Resident Small Game ( 12, under 16) 16,522 - 0.24 10.42 86,080 $ 4.50 Resident Small Game ( 16 and over) 18,836 - 0.24 18.75 176,588 $ 5.00 Resident Fishing ( 16 and over) 117,925 - 0.24 20.83 1,228,189 $ 10.00 Resident Combination ( 16 and over) 115,436 - 0.24 41.67 2,405,109 $ 2.00 Resident Fishing ( 63 and over) 10,796 - 0.24 8.33 44,965 $ 6.00 Resident Trapping ( any age) 241 - 0.24 25.00 3,013 $ 0.50 Resident Fishing ( Blind- Disabled) 123 - 0.24 2.08 128 $ 20.00 Resident Guide ( 21 and over) 88 - - 1,760 $ 3.00 Commercial Hunt Area Total Resident Licenses Sold ( 12 and over) 63 406,044 - 0.24 12.50 394 4,989,656 $ 2.50 Nonresident Fishing - 2 days ( any age) 51,253 - 0.24 10.42 267,028 $ 5.00 Nonresident Fishing - 5 days ( any age) 39,456 - 0.24 20.83 410,934 $ 15.00 Nonresident Fishing - season ( any age) 5,720 - 0.24 62.50 178,750 $ 20.00 Nonresident Small Game ( 12 and over) 964 - 0.24 83.33 40,165 $ 75.00 Nonresident Deer ( 16 and over) 19,757 - 0.24 312.50 3,087,03 la $ 150.00 Nonresident Guide ( 21 and over) 2 - - 300 $ 40.00 Nonresident Guide's Agents ( 16 and over) 7 - - 280 Total Nonresident Licenses S< TOTAL LICENSES SOLD 3 Id 117,259 523,203 3,984,489 8,974,144 aSource: State of Utah Division of Wildlife Resources. July 1974- July 1976 Biennial Report. Estimated. 43 |