OCR Text |
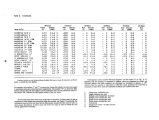
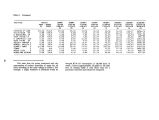
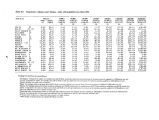
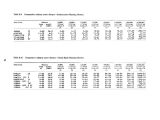
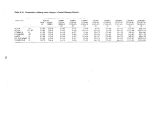
Show Table 8. Heavy mater user industries- 1968. Code Industry Group Col. 1 Number of Employees ( 1,000) Col. 2 Water Intake From Private Water Systems ( Billions of Gallons) Col. 3 Water Intake From Private Water Systems Per Employee ( Col. 2 -^- Col. 1) 20 Food and Kindred Products 1,632.4 603.6 369,762.3 28 Chemical and Allied Products 856.3 4,221.9 4,930,398.2 29 Petroleum and Coal Products 141.0 1,252.3 8,881,560.1 32 Stone, Clay, Glass Products 590.1 216.1 366,204.1 33 Primary Metal Industries 1,274.7 4,808.8 3,772,495.4 34 Fabricated Metal Products 1,357.8 20.5 15,097.9 36 Electric, Electronic Equipment 1,882.7 38.0 20,183.7 37 Transportation Equipment 1,887.6 190.8 101,080.7 39 Misc. Manufacturing Industries 430.7 8.2 19,038.7 All Nine Heavy Use Industries 10,053.3 11,360.2 1,129,997.1 Source: Column 1 is from U. S. Bureau of the Census, Annual Survey of Manufactures 1968- 1969, General Statistics by Major Industry Groups. Column 2 are from U. S. Bureau of the Census, Census of Manufactures 1967, Series No. 67( l)- 2. Table 9. Estimate of industrial mater use for the State of Utah, 1970. Code Industry Group Col. A Number of Employees* Water Intake From Private Water Systems ( Million Gallons) Col. Ax Col. 3 . Table 8 20 28 29 32 33 34 36 37 39 Food and Kindred Products Chemical and Allied Products Petroleum and Coal Products Stone, Clay, Glass Products Primary Metal Industries Fabricated Metal Products Electric, Electronic Equipment Transportation Equipment Misc. Manufacturing Industries All Nine Heavy Water Use Industries 6,928 1,999 1,204 ( NA) 8,115 4,093 9,794 5,405 5,417 42,955 2,561.7 9,855.9 10,693.4 ( NA) 30,613.8 61.8 197.7 546.4 103.1 54,633.8 aNumbers of Employees are from Bureau of Economic Analysis, Regional Economics Information System, Employment by Selected Industrial Sectors ( Utah). In 1974 Bountiful, Utah, sold 1,256,669,390 gallons of water at an average price of 26.8 cents per 1,000 gallons. Assuming the price elasticity of demand to be .75 based on a recent study of urban water use ( Gardner and Schick, 1964), the revenue maximizing water user fee would be 35.7 cents per 1,000 gallons. This makes the total rate, including the add- on fee, 62.5 cents per 1,000 gallons and the maximum revenue generating potential $ 224,315. Table 16 shows the maximum revenue generating potential for 16 Utah cities which provided enough information about revenues and water volume in the 1975 water rate survey discussed in Chapter IV to enable calculations. These 16 cities with combined population of 133,136, represent 11.33 percent of the projected 1974 Utah population ( Utah Population Work Committee, 1975). A multiplier of $ 10.87/ capita was calculated by dividing the sample's total revenue by total population. Applying this multipier to Utah's projected 1974 population ( UPWC, 1975) yields a revenue of $ 12,771,000. This number, as would be expected, is lower than the estimate for Utah shown in Table 3. Public supplies in Table 3 include quantities for some industrial uses. 40 |