| OCR Text |
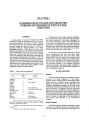
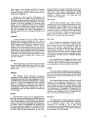
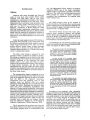
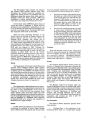
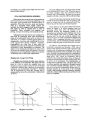
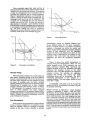
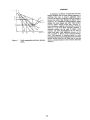
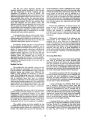
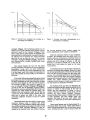
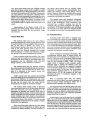
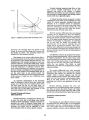
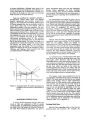
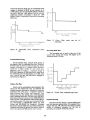
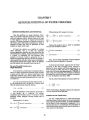
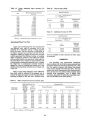
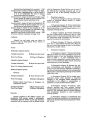
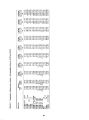
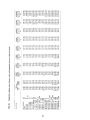
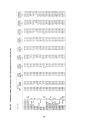
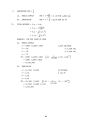
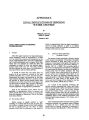
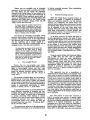
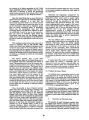
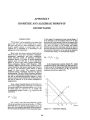
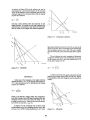
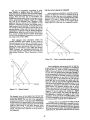
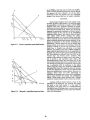
Show Some economists argue that water service, at least in instances where more distant sources must be sought is not a decreasing cost industry. All economies of scale have disappeared due to increasing costs of providing for treatment and for system expansion. Figure 3 graphically represents an increasing cost industry. Setting the price equal to average cost, Pa, encourages over use as Qa will be demanded. The marginal cost of producing the last unit, however, exceeds the price by PaPc. Average cost pricing in this situation is obviously a poor business practice. With the price set equal to marginal cost, conservation is encouraged as the quantity demanded is reduced to Qe. The price reflects the costs of production, allocates the resource efficiently, and generates a pure economic profit equal to the rectangle P| jPeAB. Quani i ty Price % Qe Qa Qu^ 1 itv Figure 3. Increasing cost industry. Monopoly Pricing When the primary objective of a water utility is to raise money, monopoly pricing is the most effective because it maximizes profit with the firm producing at the point where marginal cost and marginal revenue are equal. If marginal costs are below marginal revenue, selling one or more unit will increase profits. Alternatively, if marginal cost is above marginal revenue, additional units decrease profits. In Figure 4, MR represents the marginal revenue curve. At point G, where marginal cost equals marginal revenue, the price is Pm, the quantity demand is Qm, and the firm generates a profit equal to the rectangle ABCPm. Clearly, the result of maximizing revenue is under utilization of resources. Price Discrimination Some resources are purchased by various distinct groups of buyers ( residential and industrial water users, for example). When it is possible to separate markets in this way, it also is possible to practice Figure k. Monopoly pricing. discriminatory pricing by charging different user groups different prices for the same commodity. Because marginal revenue is a function of demand elasticity, a monopoly can divide the market and allocate output among submarkets equating marginal revenue in each submarket with the aggregate marginal revenue at the marginal cost point. In this situation, price is established by the demand in each submarket. The more elastic the demand in the submarket, the lower the equilibrium submarket price. Figure 5 shows how profit maximization is achieved with price discrimination. There are two market demand curves. DJDJ represents one and D2D2 represents another. MRi represents the marginal revenue in the first submarket and MR2 represents the marginal revenue in the other submarket. The curve MR represents the aggregate marginal revenue. By including the aggregate marginal and average cost curves, the profit maximizing prices can be determined. The profit maximizing performance is now reduced to a monopoly problem. The total output should be Q at which MC = EMR. In submarket 1 the price is set at Pj and the quantity sold is Qj_. In submarket 2 the price is P2 and the quantity sold is Q2. Marginal revenue in submarket 1 equals marginal revenue in submarket 2 equals r with this sales distribution. If total output and sales were less than Ql marginal revenue in one market or the other ( or both) would be greater than r and marginal cost less than r. Increases in quantity up to Q would therefore add more to total receipts than to total costs and would increase profits. If total output and sales were expanded beyond Qj marginal cost would exceed r and marginal revenue in one or both markets would be less than r. Such increases in production would add more to total costs than to total receipts and would decrease profits. 11 |