| OCR Text |
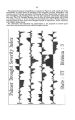
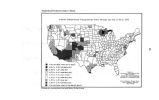
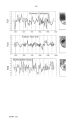
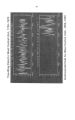
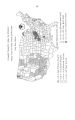
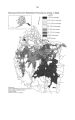
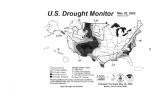
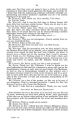
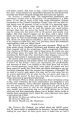
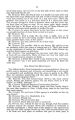
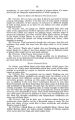
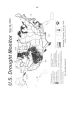
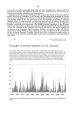
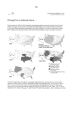
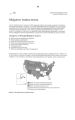
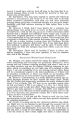
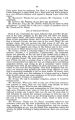
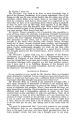
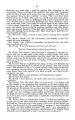
Show 10 port to the 2002 Winter Games in the Salt Lake City area was very successful, provided by a unique team from the public, private, and academic sectors. Since we have concentrated on short- range predictions in the past seven years, I sought out the best source of reliable information on drought at the National Drought Mitigation Center ( NDMC) located at the University of Nebraska- Lincoln, whose Director is a long- time colleague of mine, Professor Donald Wilhite. Much of the material I will present today came from the NDMC and some other material from Professor Don Jensen, the Utah State Climatologist at Utah State University. Drought originates as a deficiency in precipitation over an extended period, compared to the long- term average. It is a common, recurring feature of climate, but drought is a temporary phenomenon, distinct from aridity which is a permanent condition. Drought has been termed a " Creeping Phenomenon" because it is difficult to detect, either the onset or the end of a drought. It is extremely difficult to predict either the length or the severity of droughts. Drought is measured by the amounts of rainfall, snowpack, streamflows, and other water supply indicators compared to the averages. Since these parameters vary from one location to another, especially in the mountains, data is required from many locations to determine the presence of a drought. To simplify the analysis of these thousands of bits of data, climatologists have devised drought indices, where a single number represents all of the data in one easily understood value showing the severity and duration of a drought. There are several different drought indices, but I will discuss only the two main indices. First is the Palmer Drought Severity Index ( PDSI) first devised in 1965, and since then it has been used by the U. S. Department of Agriculture and others. A time series of the PDSI has been calculated back to 1895 and is shown in Figure 1 for the Wasatch Front. Prominent droughts during several periods are clearly visible. The second major index is called the Standardized Precipitation Index ( SPI), first devised in 1993 by Tom McKee at Colorado State University, which identifies droughts many months before the PDSI. Further, it can be computed over various time scales which are appropriate for different economic effects such as agriculture or water supplies. An example of the SPI for a 4- month period through 30 April 2002 is shown in Figure 2. A common question is " How does the current drought compare to past droughts?" Weather instruments have been deployed for more than 100 years, so past data are available to determine the severity and length of droughts, as shown previously in Figure 1, depicting the PDSI for the Wasatch Front from 1895- 2000. Figure 3 shows similar data for northern California. Beyond the instrumented period, climatologists use proxy paleoclimate data from tree rings, lake and dune sediments, and historical and archaeological records dating back thousands of years. Tree ring data for west- central Utah during the period 1700- 1978 are shown in Figure 4. The most severe droughts in this period occurred about 1730, 1815, and in the 1930s. Other paleoclimate data exist for much longer periods, and they show that even more extreme droughts of greater length have occurred in the distant past. According to archaeologists, such extreme droughts very likely were a major cause of the demise of the Anasazi and Mayan cultures. Since these extreme, long- lasting droughts have occurred in the past, it is reasonable to assume that they may occur in the future, too. Global climate change is one of the main scientific issues of our time, and the relationship of drought to climate change is a significant issue for this committee. Global climate models show that the increased greenhouse gases like carbon dioxide and methane will increase the Earth's temperature in the 21st Century. It will also bring increased precipitation in the high latitudes and less in the low latitudes. Some modelers speculate, that in mid- latitude continental regions, droughts may become more severe and longer lasting. However, these models cannot yet determine accurately the regional effects on climate nor whether extreme events like droughts will occur more often. At this time, we cannot be sure whether future droughts in the Western United States will be more severe and longer or that they will occur more frequently. Let me turn now to the current drought situation in Utah and the other Western States. Figure 2 is the 4- month Standardized Precipitation Index which shows that over this period it has been extremely dry over southeast Utah and very dry over the remainder of the State, while southern California, western Arizona, and the southernmost part of Nevada have been extremely dry. Figure 5 shows the current Palmer Drought Severity Index through 25 May 2002. The southeastern part of Utah is in extreme drought, while the western half is in a severe drought; only the northeastern part of Utah is in a near normal condition. Southern California and most of Nevada, Arizona, New Mexico, and Colorado also are in an extreme drought. |