| OCR Text |
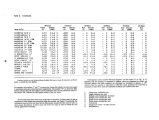
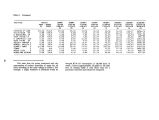
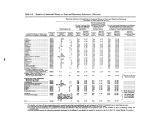
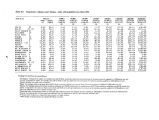
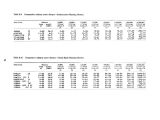
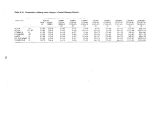
Show Table 6. Revenue potential from irrigation user fees ( Utah County). Total Tax Rate Per Cost Per Company Stockholders Amount Cost per Acre Foot Revenue Stockholder Used ( acre foot) Acre Foot ( Dollar) ( Dollar) ( Dollar) Alpine 200 6,125 0.85 0.64 1,960.00 9.80 Alta Ditch 10 1,113 22.21 16.70 9,293.55 929.35 American Fork 1,100 18,386 2.05 1.54 14,157.22 12.87 Cedar Fork 31 1,750 0.52 0.39 314.25 10.14 Coffman Springs 11 339 0.69 0.52 88.14 8.01 Current Creek 28 7,500 1.18 0.89 3,337.50 119.20 Dixon 15 1,100 2.50 1.88 1,034.00 68.93 East River Bottom 70 1,379 0.48 0.39 268.90 3.84 East Warm Creek 12 3,500 0.12 0.09 157.50 13.13 Fairfield 26 2,100 1.63 1.22 1,281.00 49.27 90 229 0.64 0.48 54.96 0.61 Fortfield- Little Dry Creek 126 3,027 0.99 0.74 1,120.00 8.89 Goshen 115 3,924 0.51 0.38 745.56 6.48 Holladay Fid. Ditch 9 693 0.76 0.57 197.50 21.94 Hollow Water 51 1,925 0.19 0.14 134.75 2.64 Lake Bottom 92 3,535 0.82 0.62 1,095.85 11.91 Lake Shore 110 7,835.6 0.73 0.55 2,154.79 19.59 Lake Side 16 2,345 0.08 0.06 70.35 4.40 Lehi 860 20,580 1.56 1.17 12,039.30 14.00 Lindon Pumping 100 1,365 0.21 0.16 109.20 1.09 Map let on 450 11,277.1 1.70 1.28 7,217.34 16.04 Matson Spring 10 779 1.77 1.33 518.03 51.80 Mitchell Hollow 39 480 2.10 1.58 379.20 9.74 North Union 354 6,272 1.92 1.44 4,515.84 12.76 Pioneer Pumping 7 525 0.57 0.43 112.88 16.12 Pleasant Grove 782 16,622 1.89 1.42 11,801.62 15.09 Provo Bench Canal 800 40,906 0.49 0.37 7,567.61 9.50 Provo River Water Users 10 75,102 1.66 1.25 46,938.75 4,693.87 Rock Canyon 68 1,855 0.48 0.36 333.90 4.91 Salem 375 8,230.6 1.34 1.01 4,156.45 11.08 Salem Pond 35 2,100 0.40 0.30 315.00 9.00 South Ditch 30 438 4.38 3.29 720.51 24.02 South Fields 15 700 3.85 2.89 1,001.50 66.77 Spanish Fk. South 200 15,301 1.06 0.80 6,120.40 30.60 Spanish Fk. E. Bench 200 15,957.2 1.43 1.07 8,537.10 42.68 Spanish Fk. West 195 16,196.9 0.82 0.62 5,021.04 25.75 Spring Creek 76 2,800 0.71 0.53 748.00 9.76 Strawberry Wat. Users 1,200 70,031 0.91 0.68 23,810.54 19.84 Strawberry Highline 600 48,211.1 1.03 0.77 18,561.27 30.93 Summit Creek 160 12,250 3.95 2.97 18,191.25 113.67 Timpanogus Canal 310 4,314 0.54 0.41 884.37 2.85 Upper East Union 210 4,636 0.56 0.42 973.56 4.64 Utah Lake District 350 16,629 0.76 0.57 4,739.26 13.54 Warm Spring 12 4,550 0.20 0.15 341.25 28.44 Wash Creek 12 931 0.46 0.34 158.27 13.19 West Union 1,030 7,454 4.29 3.22 12,000.94 11.65 Woods Springs 15 1,550 0.57 0.43 333.25 22.22 Other companies exist but either no records were kept or their water was used other than by stockholders. Total Revenues = $ 235,607.45 ^. R. = fq- lii e = 1.33 price and thus can be considered relatively inelastic. Since the maximum fee assessable is inversely related to elasticity of demand, the smaller the elasticity the greater the fee that can be imposed. Although low elasticity of demand is probable, a range of values for elasticity is considered in computing user fee capital generating possibilities. Another major consideration in user fee determination is the cost of supplying water to the user. The costs in Table 11 are generalized estimates for moving water from the source to the user facilities. Storage and collection costs at points of origin and distribution and treatment costs at the point of use are not included. 38 |


