| Title |
Report on library acquisitions |
| Creator |
Laird, W. David, 1937- |
| Contributor |
Madsen, Brigham D. |
| Publisher |
Digitized by J. Willard Marriott Library, University of Utah |
| Date |
1971 |
| Subject |
University of Utah. Libraries; Acquisitions (Libraries); Madsen, Brigham D. -- Correspondence; Marriott, J. Willard (John Willard), 1900-1985 -- Correspondence |
| Keywords |
Marriott; Library; Gift |
| Description |
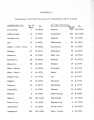
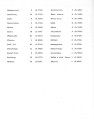
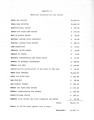
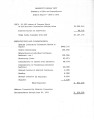
P. 5 a one-page typewritten letter, dated Dec. 20, 1971, from Brigham D. Madsen, Director of Libraries, to J. Willard Marriott. In it he says, "... one of my first obvious responsibilities was to prepare a report of library resource material purchased from funds established by your very generous gift." He goes on to say the W. David Laird, former Acquisitions Librarian and now Assoc. Director of the Library, has compiled such a report, and that Dr. Aziz Atiya, on a visit to Washington, will deliver the report to Marriott. The rest of the 13 pages comprise this report |
| Type |
Text |
| Format |
application/pdf |
| Collection Name |
0480_018_002 |
| Collection Number and Name |
0480_018_002 Aziz Suryal Atiya Papers |
| Language |
eng |
| Rights |
 |
| Relation |
http://archiveswest.orbiscascade.org/ark:/80444/xv99560 |
| Conversion Specifications |
Original scanned on Epson Expression 10000 XL and saved as 400 ppi TIFF. Display image generated in CONTENTdm |
| Scanning Technician |
Niko Amaya |
| File Name |
0480_018_002_Holding_Reports_Stapled_Set_13.pdf |
| ARK |
ark:/87278/s6ms4kh9 |
| Setname |
uum_asap |
| ID |
779876 |
| Reference URL |
https://collections.lib.utah.edu/ark:/87278/s6ms4kh9 |