| Title |
Annual Report of the Commissioner of Indian Affairs - 1912 |
| Subject |
Indian reservations; Federal government; Indians of North America; Maps; Work; Land use; Allotment of land; Treaties; Agriculture; Timber; Health; Indians of North America--Social life and customs; Water rights; Natural resources; Livestock; Grazing; Art; Culture; Education; Indians of North America--Education; Irrigation; Annuities; Alcohol; Indigenous peoples--North America |
| Keywords |
Annual Report; Indian Agency; Reservations; Land Rights; Mining; Allotment; Tribal Funds; Superintendency; Native Americans |
| Publisher |
Digitized by J. Willard Marriott Library, University of Utah |
| Tribe |
Ute |
| Language |
eng |
| Description |
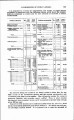
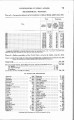
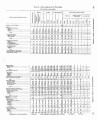
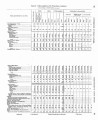
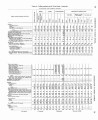
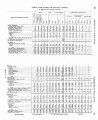
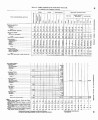
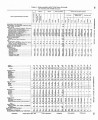
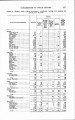
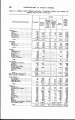
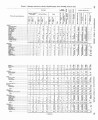
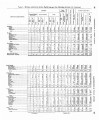
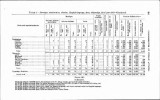
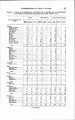
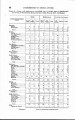
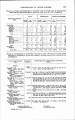
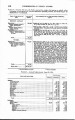
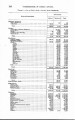
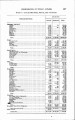
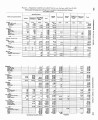
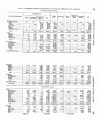
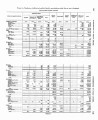
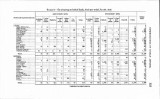
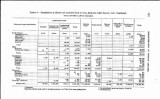
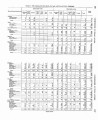
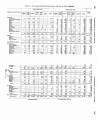
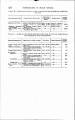
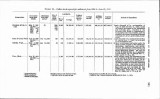
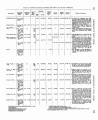
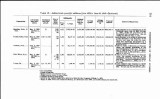
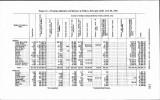
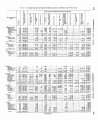
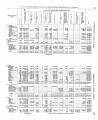
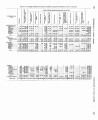
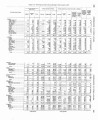
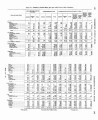
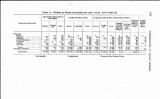
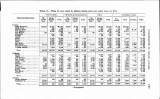
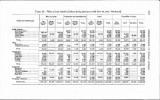
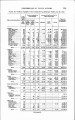
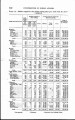
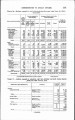
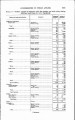
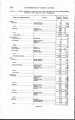
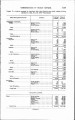
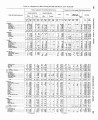
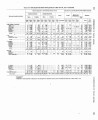
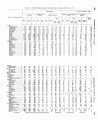
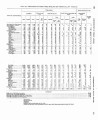
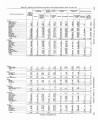
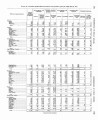
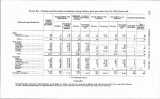
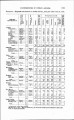
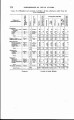
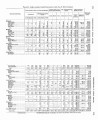
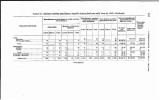
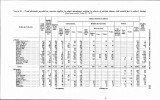
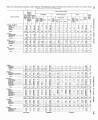
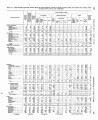
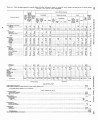
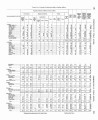
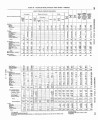
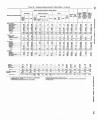
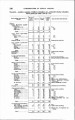
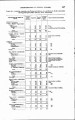
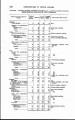
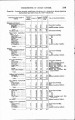
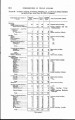
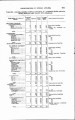
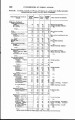
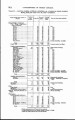
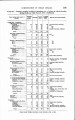
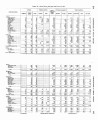
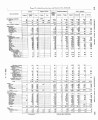
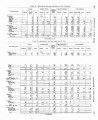
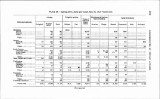
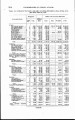
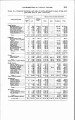
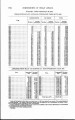
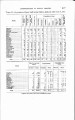
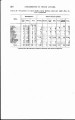
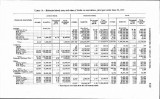
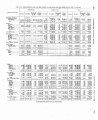
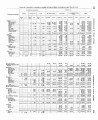
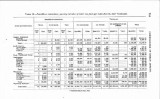
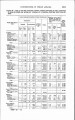
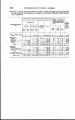
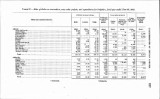
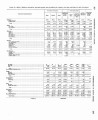
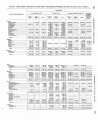
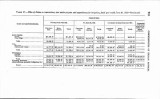
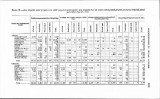
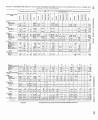
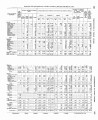
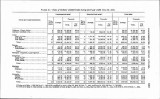
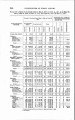
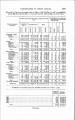
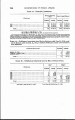
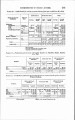
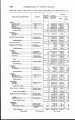
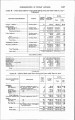
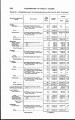
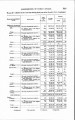
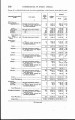
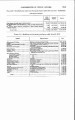
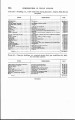
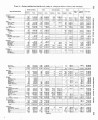
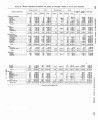
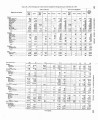
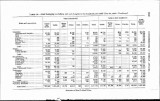
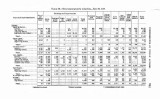
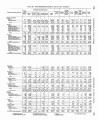
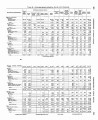
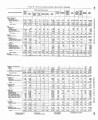
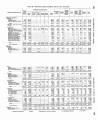
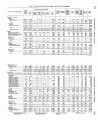
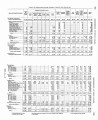
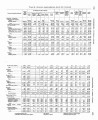
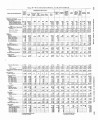
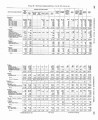
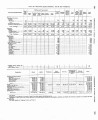
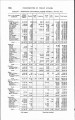
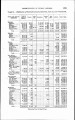
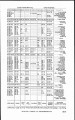
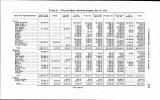
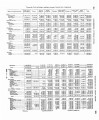
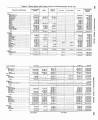
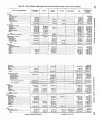
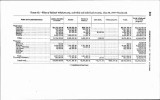
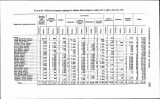
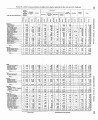
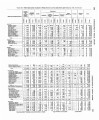
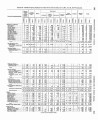
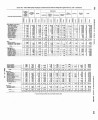
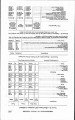
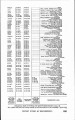
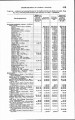
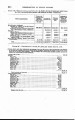
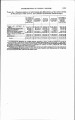
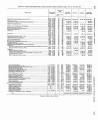
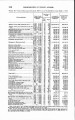
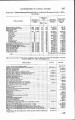
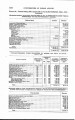
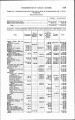
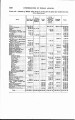
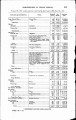
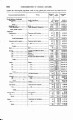
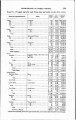
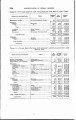
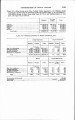
Excerpts concerning Utah from the Annual Report of the Commissioner of Indian Affairs - Courtesy of the University of Wisconsin Digital Collections. The Commissioner of Indian Affairs expresses his opinion that the Dawes Act did not accomplish its attentions or deliver upon its promises. The Commissioner discusses the distribution and use of appropriated funds, eliminating schools based on a lack of attendance/need, defects within the agency and a new processes by which "Indian codes" should be drafted, efforts to prevent epidemics on reservations (including tuberculosis in schools), measures to prevent liquor consumption, large-scale irrigation projects, the process by which Indian land may be leased, etc. The Commissioner provides data and tables pertaining to America Indians; data indicates that over 3,000 Indians fall under the jurisdiction of the Utah Superintendency. The tables also outline the suppression of liquor traffic, treaties with the Utes, and Ute land that has been made available for sale to non-Indians |
| Type |
Text |
| Coverage |
Uintah and Ouray Indian Reservation (Utah); Utah; Washington (D.C.) |
| Format |
application/pdf |
| Rights |
Digital Image © 2011 America West Center. All Rights Reserved |
| ARK |
ark:/87278/s69k76xd |
| Creator |
Commissioner of Indian Affairs; Valentine, Robert G. (Robert Grosvenor), 1872-1916 |
| Date |
1912 |
| Spatial Coverage |
Uintah and Ouray Indian Reservation (Utah); Washington (D.C.); Utah |
| Setname |
uaida_main |
| ID |
376149 |
| Reference URL |
https://collections.lib.utah.edu/ark:/87278/s69k76xd |