| OCR Text |
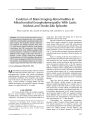
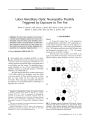
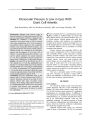
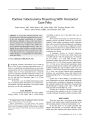
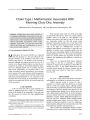
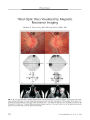
Show ORIGINAL CONTRIBUTION Evolution of Brain Imaging Abnormalities in Mitochondrial Encephalomyopathy With Lactic Acidosis and Stroke- Like Episodes Wenya Linda Bi, MA, Joachim M. Baehring, MD, and Robert L. Lesser, MD Abstract: An 18- year- old man developed consecutive homonymous hemianopias that were eventually attributed to mitochondrial encephalomyopathy with lactic acidosis and stroke- like episodes ( MELAS). The diagnosis was initially suspected when brain CT scans showed bilateral dystrophic basal ganglia calcifications and MR spectroscopy later showed a prominent lactate peak. Diffusion- weighted MRI showed progressive evolution of restricted proton diffusion at the margins of the lesion from day 3 through 3 weeks. Genetic testing from peripheral blood confirmed an A3243G transition in the patient's MTTLl gene encoding the transfer RNA for leucine. The patient's visual function improved, but severe atrophy of gray and white matter was visible on MRI. (/ Neuro- Ophthalmol 2006; 26: 251- 256) itochondrial encephalomyopathy with lactic acidosis and stroke- like episodes ( MELAS) is a progressive neurodegenerative disorder with variable presentations, underlying genetic mutations, and diagnostic features. Such heterogeneity complicates early recognition and management of the disease and fuels debate over its pathophysiology. A classic spectrum of imaging features can often reinforce the diagnosis. We present the evolution of imaging changes in a patient followed for 18 months. CASE REPORT An 18- year- old man awoke one morning complaining of a severe headache, inability to see in his left hemifield, nausea, and vomiting. He had a family history of " aneurysms" and strokes in several maternal relatives at Departments of Neurobiology ( WLB), Neurology ( JMB, RLL), Neurosurgery ( JMB), and Ophthalmology and Visual Sciences ( RLL), Yale School of Medicine, New Haven, Connecticut. Address correspondence to Robert L. Lesser, MD, The Eye Care Group, 40 Temple St., Suite 5B, New Haven, CT 06510; E- mail: rlesser4@ optonline. net young ages. His mother had hearing loss in both ears attributed to chronic otitis media. Physical examination was significant for short stature, absent bowel sounds, extinction to double simultaneous visual stimuli within the left visual field, mild proximal muscle weakness, markedly brisk deep tendon reflexes, and a left upper extremity downward drift. Formal visual field testing confirmed a dense left homonymous hemianopia ( Fig. 1). Two days after presentation, the patient suffered two generalized tonic- clonic convulsions. Phenytoin therapy was initiated. Brain CT scanning on the day of presentation revealed dense bilateral calcification of the basal ganglia ( Fig. 2). MRI performed the next morning demonstrated slightly increased signal, mostly involving the right occipital, temporal, and posterior parietal cortex on FLAIR sequences ( Fig. 3). Diffusion- weighted imaging ( DWI) and apparent diffusion coefficient ( ADC) mapping failed to demonstrate restriction of proton movement, decreasing the likelihood of an acute ischemic infarct ( Fig. 4). Cerebral angiography failed to identify vascular abnormalities. Although encephalitis was a consideration, the presence of bilateral calcifications in the basal ganglia raised concern for a metabolic disorder. Three days after the patient's initial presentation, repeat MRI showed a further increase in right parieto-temporo- occipital hyperintensity on T2 sequences ( Fig. 3). Relative sparing of the white matter was again observed. MR spectroscopy revealed reduced / V- acetylaspartate and a prominent lactate doublet in the affected region ( Fig. 5). Focal gyriform hypointensity on ADC images corresponding to increased signal on DWI now suggested restricted proton diffusion ( Fig. 4). However, other portions of the involved area were characterized by increased signal on ADC map indicative of " T2 shine through". Corroborating the spectroscopy abnormalities, laboratory studies revealed elevated fasting lactic acid ( 7.9 mmol/ L [ normal 0.5- 2.2 mmol/ L]), pyruvic acid ( 0.30 mmol/ L [ normal 0.03- 0.10 mmol/ L]), lactic dehydrogenase ( 415 units/ L [ normal 118- 242 units/ L]), and creatine kinase ( 4,150 units/ L [ normal 24- 195 units/ L]) J Neuro- Ophthalmol, Vol. 26, No. 4, 2006 251 J Neuro- Ophthalmol, Vol. 26, No. 4, 2006 Bi et al FIG. 1 . Visual fields performed on initial presentation show a dense left homonymous hemianopia. levels. Urine analysis for organic acids also showed dramatically increased lactic acid, 3- hydroxybutyric acid, and acetoacetic acid levels. These clinical and imaging findings are characteristic of MELAS ( 1- 4). Genetic testing from peripheral blood confirmed an A3243G transition in the patient's MTTLl gene encoding the transfer RNA for leucine, the most common mutation found in MELAS ( 5). The patient was not considered to be a candidate for intravenous L- arginine therapy because of his delayed presentation ( 6,7). He was treated with daily oral L- arginine ( 10 g), coenzyme Q10 ( 300 mg), vitamin Bi ( 100 mg), vitamin B2 ( 400 mg), and folic acid ( 1 mg) in an attempt to decrease the risk of future cerebral events ( 8). FIG. 2 . Brain CT on initial presentation demonstrates dense bilateral calcification in the basal ganglia. At 21 days after his initial presentation, repeat MRI demonstrated further expansion of the brain lesion into the anterior temporal and posterior frontal lobes. Gyriform areas of restricted proton diffusion were still seen at the periphery of the lesion ( Fig. 4). Interval evolution of laminar necrosis was also noted. The hyperintense lesion on T2 images now clearly included the white matter subjacent to the cerebral cortex. The patient was discharged after nearly 4 weeks of monitoring. Over the next 3 months, he reported recovery of most of his vision, but no examination took place. Five months after this episode, the patient presented with a 2- week history of abdominal pain radiating to the lower extremities and a 2- day history of nausea, vomiting, severe headache, and new right hemifield visual loss. Brain MRI revealed new hyperintense signal in the left parietooccipital region on the FLAIR sequence ( Fig. 3) and gyriform restricted diffusion ( Fig. 4). The previously injured right posterior cortex now showed evidence of severe encephalomalacia involving gray and white matter and ex vacuo enlargement of the right lateral ventricle ( Fig. 6). MR spectroscopy again demonstrated a prominent lactate doublet peak in the regions of abnormal signal. A few days later, the patient became blind and demonstrated memory deficits. The patient was treated with one dose of intravenous L- arginine ( 30 g at 0.5 g/ kg weight), and oral L- arginine and vitamin supplementation was continued. Seven months after his original presentation, he had normal visual acuity and an incomplete right homonymous hemianopia ( Fig. 7) but was unable to return to school because of considerable impairment in memory and comprehension. No formal neuropsychologic testing was performed. At an 18 month follow- up examination, the patient reported two further episodes of transient visual loss in the right field but had not sought medical attention. DISCUSSION MELAS is a progressive neurodegenerative disorder associated with stroke- like episodes, seizures, headaches, progressive dementia, and exercise intolerance ( 1- 3). The stroke- like episodes can result in visual loss, most commonly hemianopia. Because of multi- system involvement, workup should include evaluation of heart and skeletal muscle as well as the nervous system. Whereas some cases are sporadic, MELAS is often maternally inherited, with 80% of patients harboring the A3 243 G transition within the mitochondrial genome, although many other mutations have also been reported ( 5). The diagnosis of MELAS can be made through characteristic imaging findings, elevated lactic acid levels, 252 © 2006 Lippincott Williams & Wilkins Brain Imaging in MELAS J Neuro- Ophthalmol, Vol. 26, No. 4, 2006 FIG. 3. A. Axial FLAIR MRl performed 1 day after initial presentation shows increased signal in the right temporo-occipital cortex. B. Axial FLAIR MRl performed 3 days after initial presentation shows increased gyriform hyperintensity in the same area. C. Axial FLAIR MRl performed 3 weeks after initial presentation shows an increase in the high signal area, now involving the temporal cortex and the subcortical white matter. D. Axial FLAIR MRl performed during the patient's second presentation 5 months later shows an area of new hyperintensity in the left temporo-occipital cortex. The right temporo-occipital signal abnormality seen on earlier scans remains visible. ragged red fibers on muscle biopsy, or genetic sequencing. Often the first clue will arise from imaging studies. In this patient, a hyperintense gyriform lesion on T2 MRl and bilateral dystrophic basal ganglia calcifications raised suspicion of a neurodegenerative mitochondrial disorder. Classically, the brain MRl of patients with MELAS demonstrates lesions that may mimic ischemia, except that they usually do not respect vascular territories and are often restricted to the cortex with relative sparing of deep white matter ( 2). Lesions spanning both gray and white matter, as well as those restricted to white matter, have been reported ( 9- 11). Our patient demonstrated hyperintensity on FLAIR MRl that was predominantly cortical at onset but later involved the white matter. MR spectroscopy is a diagnostically helpful technique if MELAS is suspected ( 4,9). Impairment of oxidative phosphorylation results in accumulation of metabolites such as lactic acid, which is detectable as a prominent doublet peak in brain and cerebrospinal fluid spaces. The two current hypotheses as to the pathogenesis of MELAS include primary ischemia due to angiopathy and primary metabolic neuronal death ( 12,13). The vascular hypothesis of stroke- like episodes arose from histologic studies that revealed dramatic proliferation of mitochondria in small vessel endothelium, possibly leading to transient cerebral ischemia ( 12,14,15). Subsequent studies revealed pervasive mitochondrial abnormalities throughout brain tissue and contributed to the concept of primary metabolic neuronal dysfunction as the etiology of MELAS ( 15,16). Our patient provided the opportunity to examine the evolution of DWI and ADC signals across multiple time points after his initial presentation and diagnosis of MELAS. DWI measures the net movement of water molecules or their apparent diffusion in any direction ( 17). Because DWI is based on T2 pulse sequences, ADC maps provide a more specific measure of proton diffusivity by eliminating the T2 shine- through artifact. Any condition that leads to decreased proton diffusion will result in hyperintensity on DWI and 253 J Neuro- Ophthalmol, Vol. 26, No. 4, 2006 Bi et al FIG. 4. DWI ( A, C, E, C) and corresponding ADC maps ( B, D, F, H) of serial sections on day 1 ( A- B), day 3 ( C- D), day 21 ( E- F), and day 150 ( G- H, second presentation) after the first report of symptoms. Note that increased signal in the right occipital and posterior temporoparietal cortex evolves by day 3 after presentation ( C- D, arrowheads). Correspondingly, the ADC map demonstrates low signal at day 3 that has disappeared by day 21 at previous lesion sites. However, at day 21, new lesions with low ADC signal have now developed at the right frontoparietal junction ( E- F, arrowheads). On day 150, the ADC map shows high signal in the right posterior cortex, whereas the newly affected left posterior cortex demonstrates low signal ( C- H, arrowheads). DWI - Diffusion-weighted imaging. ADC - Apparent diffusion coefficient. hypointensity on ADC. Among these conditions is ischemic infarction, which generally leads to restricted diffusion within hours of the clinical event. The lack of restricted diffusion on the initial MRI of our patient supports the argument that the cytotoxic edema of MELAS does not result from the acute ischemia of a conventional infarct but perhaps from an evolving metabolic cell death associated with mitochondrial dysfunction ( 18,19). 254 2006 Lippincott Williams & Wilkins Brain Imaging in MELAS J Neuro- Ophthalmol, Vol. 26, No. 4, 2006 FIG. 5. MR spectroscopy demonstrates an abnormally prominent lactate doublet peak in the affected right visual cortex ( A) compared with the contralateral unaffected cortex ( B). ( Insets indicate area of sampling.) At 3 weeks post- ictus, regions with previously restricted diffusion normalized to isointensity on ADC maps, but new regions of hyperintense DWI and hypointense ADC signal continued to evolve. This gyri-form expansion of the DWI- positive peripheral lesion weeks after an acute " stroke- like" episode strengthens a previous report in the literature ( 19). Our patient's second FIG. 6. Precontrast T1 MRI performed during the patient's second presentation on day 150 after his initial symptoms again demonstrates high signal in the basal ganglia compatible with complex calcium deposition. Gyriform hyperintensity in the right temporoparietal region is consistent with cortical laminar necrosis ( arrow). Ex vacuo dilatation of the right lateral ventricle is evident. FIG. 7. Visual fields performed 7 months after initial presentation show an incomplete congruous right homonymous hemianopia. presentation 5 months later with symptoms contralateral to his initial diagnosis permitted us to compare the chronic reversal of diffusion changes from the previously affected right hemisphere to the subacute development of new restricted diffusion in the left hemisphere. Even with clinical recovery of vision, laminar necrosis and severe atrophy developed as a response to injury. There is as yet no definite evidence for a benefit of treatment in MELAS or any other mitochondrial disorder. However, patients have been treated by supplementing oxidative phosphorylation components, alleviating metabolic buildup, and providing palliative measures ( 20,21). Supplements involved in the mitochondrial energetic pathway that have been anecdotally reported to improve patient symptoms include coenzyme Q, carnitine, cytochrome c, and vitamins B1; B2, C, and K ( 22- 25). Because a major source of tissue injury arises from toxic by- products of dysfunctional mitochondrial oxidative phosphorylation, such as pyruvate and its derivative lactate, the aim of some therapeutic approaches is to reduce these accumulated metabolites. A drug that has been tested is dichloroacetate ( DCA) ( 26). Although DCA, a potent lactate- lowering agent, has been used with success in patients with MELAS on occasion, the vast majority of patients assigned to DCA in a controlled, randomized clinical trial had peripheral nerve toxicity without significant improvement in disease outcome ( 26). The toxicity found in the DCA study raises a note of caution for any empiric treatment of MELAS. In addition to metabolic toxicity, some treatments target ischemic brain injury during the stroke- like episodes of MELAS. In one of the largest series of patients with MELAS patients whose condition improved with treatment, the nitric oxide precursor L- arginine was given to induce vasodilation and improve microcirculation ( 6). Most patients who received intravenous L- arginine during the acute phase of stroke- like episodes experienced a dramatic decrease in headache, nausea, vomiting, transient visual loss, and clinical disability by 30 minutes after injection ( 6). Oral supplementation of L- arginine for 18 months 255 J Neuro- Ophthalmol, Vol. 26, No. 4, 2006 Bi et al subsequently prevented any major stroke- like attacks in all patients. REFERENCES 1. Pavlakis SG, Phillips PC, DiMauro S, et al. Mitochondrial myopathy, encephalopathy, lactic acidosis, and strokelike episodes: a distinctive clinical syndrome. Ann Neurol 1984; 16: 481- 8. 2. Hirano M, Pavlakis SG. Mitochondrial myopathy, encephalopathy, lactic acidosis, and strokelike episodes ( MELAS): current concepts. J Child Neurol 1994; 9: 4- 13. 3. Michelson DJ, Ashwal S. The pathophysiology of stroke in mitochondrial disorders. Mitochondrion 2004; 4: 665- 74. 4. Moller HE, Kurlemann G, Putzler M, et al. Magnetic resonance spectroscopy in patients with MELAS. J Neurol Sci 2005; 229- 230: 131- 9. 5. Chomyn A, Enriquez JA, Micol V, et al. The mitochondrial myopathy, encephalopathy, lactic acidosis, and stroke- like episode syndrome-associated human mitochondrial tRNALeu( UUR) mutation causes aminoacylation deficiency and concomitant reduced association of mRNA with ribosomes. J Biol Chem 2000; 275: 19198- 209. 6. Koga Y, Akita Y, Nishioka J, et al. L- Arginine improves the symptoms of strokelike episodes in MELAS. Neurology 2005; 64: 710- 2. 7. Kubota M, Sakakihara Y, Mori M, et al. Beneficial effect of L-arginine for stroke- like episode in MELAS. Brain Dev 2004; 26: 481- 3. 8. DiMauro S, Mancuso M, Naini A. Mitochondrial encephalomyo-pathies: therapeutic approach. Ann NY Acad Sci 2004; 1011: 232^ 5. 9. Castillo M, Kwock L, Green C. MELAS syndrome: imaging and proton MR spectroscopic findings. AJNR Am JNeuroradiol 1995; 16: 233- 9. 10. Oppenheim C, Galanaud D, Samson Y, et al. Can diffusion weighted magnetic resonance imaging help differentiate stroke from strokelike events in MELAS? J Neurol Neurosurg Psychiatry 2000; 69: 248- 50. 11. Mizrachi IB, Gomez- Hassan D, Blaivas M, et al. Pitfalls in the diagnosis of mitochondrial encephalopathy with lactic acidosis and stroke- like episodes. JNeuroophthalmol 2006; 26: 38^ 3. 12. Ohama E, Ohara S, Ikuta F, et al. Mitochondrial angiopathy in cerebral blood vessels of mitochondrial encephalomyopathy. Acta Neuropathol ( Berl) 1987; 74: 226- 33. 13. Iizuka T, Sakai F, Suzuki N, et al. Neuronal hyperexcitability in stroke- like episodes of MELAS syndrome. Neurology 2002; 59: 816- 24. 14. Sakuta R, Nonaka I. Vascular involvement in mitochondrial myopathy. Ann Neurol 1989; 25: 594- 601. 15. Mizukami K, Sasaki M, Suzuki T, et al. Central nervous system changes in mitochondrial encephalomyopathy: light and electron microscopic study. Acta Neuropathol ( Berl) 1992; 83: 449- 52. 16. Gilchrist JM, Sikirica M, Stopa E, et al. Adult- onset MELAS: evidence for involvement of neurons as well as cerebral vasculature in strokelike episodes. Stroke 1996; 27: 1420- 3. 17. Schaefer PW, Grant PE, Gonzalez RG. Diffusion- weighted MR imaging of the brain. Radiology 2000; 217: 331^ 5. 18. Yoneda M, Maeda M, Kimura H, et al. Vasogenic edema on MELAS: a serial study with diffusion- weighted MR imaging. Neurology 1999; 53: 2182^. 19. Iizuka T, Sakai F, Kan S, et al. Slowly progressive spread of the stroke- like lesions in MELAS. Neurology 2003; 61: 1238^ 4. 20. Schon EA, DiMauro S. Medicinal and genetic approaches to the treatment of mitochondrial disease. Curr Med Chem 2003; 10: 2523- 33. 21. Thambisetty M, Newman NJ. Diagnosis and management of MELAS. Expert Rev Mol Diagn 2004; 4: 631^ 4. 22. Berbel- Garcia A, Barbera- Farre JR, Etessam JP, et al. Coenzyme Q 10 improves lactic acidosis, strokelike episodes, and epilepsy in a patient with MELAS ( mitochondrial myopathy, encephalopathy, lactic acidosis, and strokelike episodes). Clin Neuropharmacol 2004; 27: 187- 91. 23. Oguro H, Iijima K, Takahashi K, et al. Successful treatment with succinate in a patient with MELAS. Intern Med 2004; 43: 427- 31. 24. Goda S, Hamada T, Ishimoto S, et al. Clinical improvement after administration of coenzyme Q10 in a patient with mitochondrial encephalomyopathy. J Neurol 1987; 234: 62- 3. 25. Tanaka J, Nagai T, Arai H, et al. Treatment of mitochondrial encephalomyopathy with a combination of cytochrome C and vitamins Bl and B2. Brain Dev 1997; 19: 262- 7. 26. Kaufmann P, Engelstad K, Wei Y, et al. Dichloroacetate causes toxic neuropathy in MELAS: a randomized, controlled clinical trial. Neurology 2006; 66: 324- 30. 256 © 2006 Lippincott Williams & Wilkins |