| OCR Text |
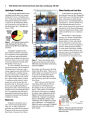
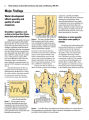
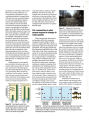
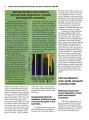
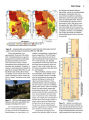
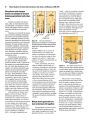
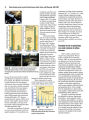
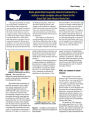
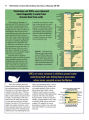
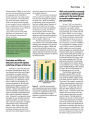
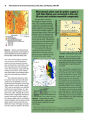
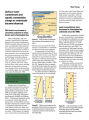
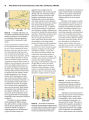
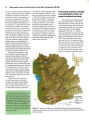
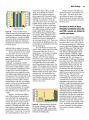
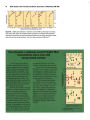
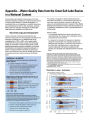
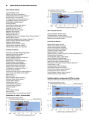
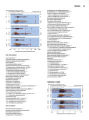
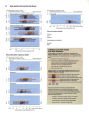
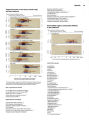
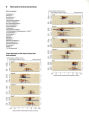
Major Findings 23 5 6 7 WEBER RIVER SITES Figure 38. Inflow from Silver Creek greatly enriches the concentration of trace elements in the sediments of Weber River and Echo Reservoir. From the mid- 1800s through the 1970s, the headwaters of the Silver Creek drainage were extensively mined for silver and lead ores ( see fig. 37 for site locations). sediments did not appear to be greater downstream from mining- affected areas. The concentrations of some metals were elevated in the water of streams draining areas with historical mining and ore smelting. For example, zinc concentrations in water samples from Silver Creek ranged from 90 to 1,800 ug/ L, exceeding the USEPA aquatic- life criterion ( adjusted for hardness) in four of eight samples. Aquatic macroinvertebrate communities at sites in upper Silver Creek with high zinc concentrations were impaired ( low species richness and a higher percentage of tolerant taxa) relative to other sites in the area with lower concentrations of zinc ( Giddings and others, 2001). Streams draining basins with little or no mining activity, such as those in the Bear River Basin, generally had low concentrations of dissolved metals. For example, zinc concentrations in water samples from Bear River sites ranged from 2 to 1 \ ig/ L. Mercury, used from the 1880s to early 1900s to process lead and silver ores in the Park City mining district, was detected in water and bed- sediment samples from Silver Creek at concentrations exceeding various aquatic- life guidelines ( Giddings and others, 2001). Total mercury concentration in stream- bed sediment from three sites on Silver Creek ( sites 2, 3, and 4, fig. 37) and one site on the Weber River ( site 6, fig. 37) ranged from about 1,000 to 27,000 | ig/ kg, far exceeding the Canadian guideline of 486 u, g/ kg, designed to protect aquatic life ( Canadian Council of Ministers of the Environment, 2002). Although concentrations of total dissolved mercury in water were below the USEPA chronic aquatic- life criterion ( 770 nanograms per liter), methylmer- cury concentrations in water exceeded the USEPA chronic criterion for fish- eating wildlife ( 0.05 nanogram per liter) ( National Irrigation Water Quality Program, 1998). Methylmercury is readily available for biological uptake and has been shown to biomagnify in the food chain ( Eisler, 1987). Thus, even small amounts of methylmercury in the environment can be harmful to biota that feed on aquatic prey. The concentration of arsenic measured in water samples from lower Little Cottonwood Creek ( site 10, fig. 37) ranged from 4.7 to 284 [ xg/ L, exceeding the USEPA aquatic- life criterion of 150 ug/ L in 8 of 49 water samples. Sources of arsenic in Little Cottonwood Creek include imported water from the Utah Lake Basin and, most notably, runoff from historical smelter sites. The August 1999 synoptic study of trace elements in lower Little Cottonwood Creek identified the area near the historical Murray smelter site as the major source of arsenic ( fig. 39). Reclamation has been done at this site; however, surface and subsurface flow near the site still appears to be contributing dissolved arsenic to the stream. £ LU z°- ui v> us S< O cc o o oo CO S cc I: Minimum Reporting Level ( 1 ug/ L) I nnnnnnnnn Figure 39. Dissolved arsenic concentration in water samples from Little Cottonwood Creek, August 1999, were greatest at sites adjacent to and downstream from historical ore- smelting sites. Streams in basins with little or no mining had arsenic concentrations less than 3 ug/ L. The metals in the water and sediment of many of the mining- affected streams of the Great Salt Lake Basins Study Unit probably will persist for many years. Increases in levels of trace elements in sediment since the mid- 19th century are related to smelter emissions Trace- element concentrations first began to increase in sediment deposited in Mirror Lake and Farmington Bay of Great Salt Lake in 1870, with a substantial increase occurring after 1900. Mirror Lake is in the Uinta Mountains, approximately 50 miles east of Salt Lake City. The surface sediments of cores taken from Mirror Lake had higher concentrations of arsenic, cadmium, copper, lead, tin, and zinc, relative to the deeper sediments ( fig. 40). Age dating of a core collected in 1998 from Farmington Bay ( Naftz and others, 2000) indicated a lead profile ( fig. 29) similar to that determined for Mirror Lake ( fig. 40). In the Farmington Bay core, the profile indicates that lead contamination began to increase after about 1842 and made the most marked increase between about 1916 and 1950. Due to the remote location of Mirror Lake, it was concluded that the increases in metal concentrations over time are related to atmospheric deposition from smelter activities. Large- scale mining and smelting of nonferrous metal ores began in the Wasatch Mountains and adjacent valleys after 1868, which would have contributed metals to the atmosphere. Industrial and energy- related sources in the Salt Lake City area also would have contributed metals to the atmosphere, and growth of these industries occurred after 1900. These dates coincide with increases in metal concentrations of the cores. In addition, lead concentrations in cores correspond to lead emissions from vehicles and other combustion sources. |