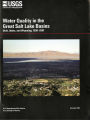
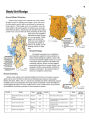
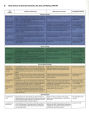
OCR Text |
Show Major Findings 17 Surface- water contaminants and aquatic communities change as watersheds become urbanized PAH levels are elevated in streambed sediment in urban basins and in Farmington Bay Many contaminants, like trace elements, organochlorine compounds, and polycyclic aromatic hydrocarbons ( PAHs), generally sorb to soil and sediment, are chemically stable and persistent, and tend to accumulate in aquatic organisms. Concentrations of PAHs in streambed sediment increase from the most upstream to the most downstream site of major urban areas in the Weber and Utah Lake- Jordan River Basins ( fig. 27). PAHs are formed by the incomplete combustion of hydrocarbons- coal, oil, gasoline, and wood- resulting from many urban sources including industrial and powerplant emissions, home heating, refuse and open burning, car and truck exhaust, tires, and asphalt roads and roofs ( Edwards, 1983). PAHs represent the largest class of suspected carcinogens ( Bjorseth and Ramdahl, 1985) and can present a threat to aquatic life ( Long and Morgan, 1991). Samples from a Jordan River site, located downstream from the Salt Lake City metropolitan area ( fig. 27), had the highest concentration of total PAHs in streambed sediments in the Study Unit ( 1,630 u, g/ kg [ micrograms per kilogram]) ( Waddell and Giddings, 2003). Contaminants deposited on land can wash into streams and seep into ground water. Soil and debris ( and any attached contaminants) carried by runoff or atmospheric deposition can settle to the bottom of reservoirs, lakes, and other impoundments in successive layers over time. USGS analysis of sediment cores ( vertical tubes of mud) from lake I Tributary ( urban) I Tributary ( urban) Jordan River 1 Jordan River Provo River Utah Lake- Jordan River Basin Utah Lake ( headwaters of Jordan River) Weber River 1 Weber River Bear River ]] Tributary ( agriculture) ~\ Tributary ( agriculture) 1 Bear River Bear River, Weber River Basin Bear River Basin Bear Lake 0 500 1,000 1,500 2,000 TOTAL PAHs IN BED SEDIMENT, IN MICROGRAMS PER KILOGRAM Figure 27. PAHs increase in sediments from upstream to downstream in each basin. bottoms across the country document changes in contamination as watersheds become increasingly more urbanized. Concentrations of total PAHs in sediment from Farmington Bay of Great Salt Lake, which receives water from the Jordan River, increased from less than 100 [ ig/ kg in sediments deposited before 1940 to more than 2,000 fig/ kg after the mid- 1980s ( Naftz and others, 2000) ( fig. 28). During this time, the population in Salt Lake County also increased, causing increased vehicular traffic and human- induced combustion products. Van Metre and others ( 2000) documented the pattern of increased PAHs 2000 1990 / SEDIMENT DEPTH, IN INCHES o oo a) - i^ ro o - • - 1980 • - 1970 / • - 1960 - 0 ' 1950 / 1940 1Q30 • i i - 2000 1995 - 1965 - 1950 1930 100 400 700 1,000 POPULATION OF SALT LAKE COUNTY, IN THOUSANDS 0 1,000 2,000 3,000 TOTAL PAHs, IN MICROGRAMS PER KILOGRAM Figure 28. PAHs have increased as the population of Salt Lake County has grown, as evidenced by an increase of these compounds with time in the sediment of Farmington Bay. for other cities in the United States and associated it with increased vehicular traffic in their watersheds. PAH concentrations in sediment will probably continue to increase as urbanization and associated vehicular traffic and fossil fuel use increase. Lead concentrations have decreased in Farmington Bay sediments since the 1980s Unlike other contaminants, lead has shown a recent decline in concentration in Farmington Bay sediments ( see inset, page 18). Recent sediments deposited during 1996- 98 indicate a 41- to 62- percent reduction in lead concentration since the peak in the mid- 1980s. The concentration of lead began to increase after about 1842, made the most marked increase between about 1916 and 1950, and peaked in the 1980s ( fig. 29). The early increases have been attributed to atmospheric deposition from historical mining activities associated with smelters in Salt Lake Valley. Mining and smelter activities had already declined considerably in Salt Lake Valley by the mid- 1980s, when the concentration of lead started to decrease o Z 4 a. 6 m[ ~ 1996 _ > 1986 • - 1974 • m - 1950 - 1916 ~ m - 1878 m ~ 1842 - » • - 1810 ^ 1776 ". • i ~ 1738 10 12 0 100 200 LEAD CONCENTRATION, IN MICROGRAMS PER GRAM Figure 29. Lead concentration in sediment core from Farmington Bay indicates increasing inputs after about 1842, coinciding with the mining and smelter activities in the region. |