| OCR Text |
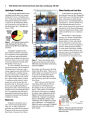
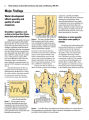
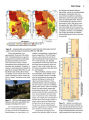
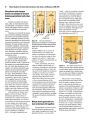
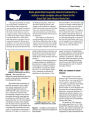
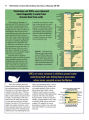
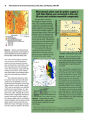
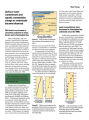
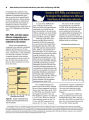
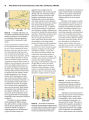
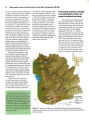
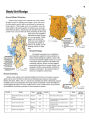
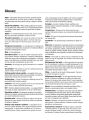
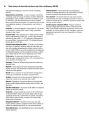
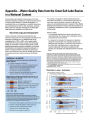
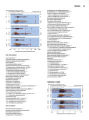
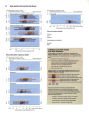
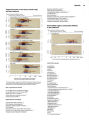
4 Water Quality in the Great Salt Lake Basins, Utah, Idaho, and Wyoming, 1998- 2001 Hydrologic Conditions Total average annual surface- water discharge from the three river systems during 1931- 76 was 2.98 million acre- feet. Of this total, about 62 percent was discharged by the Bear River Basin, 23 percent by the Weber River Basin, and 15 percent by the Utah Lake- Jordan River Basin ( fig. 2) ( Waddell and Barton, 1980). 2,500 1,500 Bear River 1.85 million acre- feet BIC FEET \ per year 3 O h z 1 . ow, Utah Lake- Jordan River 0.45 million acre- feet per year Figure 2. Total average annual surface- water discharge from the three river systems during 1931- 76 was 2.98 million acre- feet. Streamflow variability results from seasonal variations of precipitation, temperature, and evapotranspira- tion, and human- induced hydrologic modifications resulting from dams and diversions. Flows in most of the major streams and tributaries naturally peak during May to June ( fig. 3). In some watersheds, dams that create major reservoirs control streamflow. The basins have 27 reservoirs with a storage capacity greater than 6,500 acre- feet, resulting in a combined storage capacity of more than 3.5 million acre- feet. This includes Bear Lake, which has a usable storage capacity of about 1.4 million acre- feet, much of which comes from water diverted from the Bear River ( fig. 4). Snowmelt is stored in reservoirs ( usually during March through June) and is released during the irrigation season ( June through September). The regulation alters the basin's natural peak runoff period and affects the physical, chemical, and biological conditions of streams. Water Use Irrigation is the primary use of water in the Great Salt Lake Basins study unit. In 1995, irrigation for agriculture accounted for an estimated 92 percent of all water use in the Bear River Basin, 82 percent in the Weber 1998 1999 2000 2001 Figure 3. Flow in most streams in the study area was above normal during the 1999 water year, then below normal during water years 2000- 01. River Basin, and 70 percent in the Utah Lake- Jordan River Basin. Water use for public supply was estimated at 4 percent ( of all use) in the Bear River Basin, 16 percent in the Weber River Basin, and 26 percent in the Utah Lake- Jordan River Basin. Total water use in the Great Salt Lake Basins Study Unit in 1995 was estimated to be 2,797 Mgal/ d ( million gallons per day) ( U. S. Geological Survey, 1995). About 2,379 Mgal/ d ( 85 percent) of this total was supplied by surface- water withdrawals and 418 Mgal/ d ( 15 percent) by ground- water withdrawals. Irrigation accounted for about 2,130 Mgal/ d in surface- water withdrawals and 139 Mgal/ d in groundwater withdrawals. An estimated 193 Mgal/ d of surface water and 240 Mgal/ d of ground water were withdrawn for public supply. Water Quality and Land Use As the major rivers emerge from the headwater areas and flow through the broad valleys east of the Wasatch Mountains, water quality is similar among the three rivers, controlled primarily by natural factors. At lower altitudes west of the Wasatch Mountains, however, and to a lesser extent in the areas east of and adjacent to the Wasatch Mountains, human and natural factors differ considerably and affect the rivers in different ways. Natural factors of physiography, geology, soils, climate, and hydrology largely determine the natural background quality of water, and cultural factors of population, land and water use, and water- and waste- management practices define the human influence on water quality. Hydrologic modifications of streams, along with point and nonpoint sources of contaminants, have had detrimental effects on the quality of ground- water and surface- water 40 EXPLANATION Capacity, in acre- feet 6,500 to 20,0 • 20,000 to 50,0 • 50,000 to 100,000 % 100,000 to 250,000 111 250,000 to 1,000,000 More than 1,000,000 50 KILOMETERS Figure 4. Reservoir capacity in the Great Salt Lake Basins Study Unit exceeds 3.5 million acre- feet. |