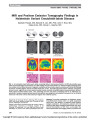
| OCR Text |
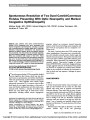
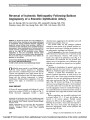
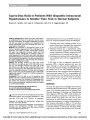
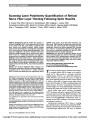
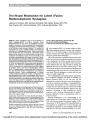
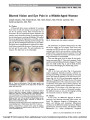
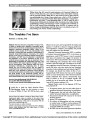
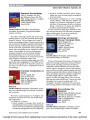
Show Rarebit Perimetry for Bedside Testing: Comparison With Standard Automated Perimetry Samuel K. Steven Houston, BS, Eric D. Weber, MD, Sebastian F. Koga, MD, Steven A. Newman, MD Abstract: Background: Rarebit perimetry (RBP), a tech-nique developed for the detection of early damage to the afferent visual system, has not been extensively tested at the bedside. This study was designed to test the feasibility of bedside testing with RBP in comparison with standard automated perimetry (SAP) performed in the clinic. Methods: We tested 29 eyes of 15 subjects admitted with neurologic or neurosurgical diseases affecting the affer-ent visual system. RBP was performed on a laptop com-puter at the bedside. SAP (Humphrey field analyzer) testing was performed later in the clinic. Results were evaluated by a masked neuro-ophthalmologist. Results: Visual fields corresponded between RBP and SAP in 21(72%) of the 29 tested eyes. RBP detected defects in 5 subjects who had normal visual field results on SAP. All subjects preferred RBP for convenience. Conclusion: RBP is a convenient method of bedside visual field testing and is no less sensitive to visual field defects in this role than SAP. Journal of Neuro-Ophthalmology 2010;30:243-247 doi: 10.1097/WNO.0b013e3181dee88a 2010 by North American Neuro-Ophthalmology Society Detecting and monitoring early visual field damage is important in lesions of the afferent visual pathways. Standard automated perimetry (SAP) utilizes white-on-white threshold testing that measures the presence of a visual defect and compares results with a normative database (1). The test targets are large and stimulate adjacent receptive fields, often underestimating the amount of damage (2). A large proportion of ganglion cells may be lost before SAP generates an abnormal result (3-6). Rarebit perimetry (RBP), developed by Frise´n in 2002 for the detection of early visual field damage, utilizes briefly exposed microdots to test the presence of vision or com-pleteness of the neuroretinal architecture. Any defects in the architecture produce sieve-like visual field defects that maintain their retinotopic features. RBP reports mean hit rate (MHR), which should be 100% if the neuroretinal matrix is intact (7). However, as a result of the physiological blind spot, angioscotomata, blinks, and attention lapses, values for normal individuals may vary (8-9). Values for normal subjects and the effect of age on MHR (Table 1) have been reported, including test-retest variability, learning effect, influence of optical defocus, and cataract extraction in normal subjects (2,7,10-12), but an extensive normative database is lacking. Promising results have been reported for RBP in detecting early damage from glaucoma and neuro-ophthalmologic disorders as compared to frequency-doubling technology and SAP (2,7,10,13). Ophthalmologists are frequently consulted to evaluate visual disorders in inpatients. Visual fields are an important component of the examination, but bedside testing is usually limited to the use of finger confrontation or pro-jection techniques that are highly variable and have been shown to detect only dense defects (14). More quantitative assessment is desirable, but many patients are unable to undergo formal visual field testing because they are bed-ridden, unable to sit up or be transported, are continuously monitored, or otherwise unstable. A bedside visual field test must be convenient, portable, and comparable to SAP. RPB is an easy patient-friendly option that can be carried out on a personal computer with a liquid crystalline display (LCD). Unlike automated perimetry, RBP is portable and easily administered with the patient lying in bed. Testing provides a quantitative and topographic picture of the visual field, making this method far superior to confrontation testing. Studies have also shown that RBP is comparable to SAP and may even be superior at detecting subtle damage. Previous studies have recognized the practical role of RBP in testing at the bedside (2,7,12,13). The purpose of this study was to test the feasibility of RBP in the inpatient setting. METHODS Test Subjects Our study included 29 eyes from 15 consecutive ophthal-mology consultations. Following investigational review board approval and informed consent, all patients un-derwent testing of their visual acuity at near using their own University of Virginia School of Medicine (SKSH), Charlottesville, Virginia; Departments of Ophthalmology (EDW, SAN) and Neuro-surgery (SFK), University of Virginia, Charlottesville, Virginia; and Department of Ophthalmology, Walter Reed Army Medical Center (EDW), Washington, District of Columbia. The authors state that they have no conflicts of interest. Address correspondence to Steven A. Newman, MD, Department of Ophthalmology, University of Virginia, P.O. Box 800715, Charlottesville, VA 22908; E-mail: san7a@virginia.edu Houston et al: J Neuro-Ophthalmol 2010; 30: 243-247 243 Original Contribution Copyright © North American Neuro-ophthalmology Society.Unauthorized reproduction of this article is prohibited. glasses or a standard near correction. Their visual fields were also evaluated using finger confrontation at the bedside. RBP was performed on each eye separately as the subjects lay in bed. Within several days, the subjects were brought to the clinic for formal visual field testing with SAP by means of Humphrey field analyzer 24-2 Swedish Interactive Thresholding Algorithm Fast program. Results of RBP and SAP were analyzed and compared by a masked neuro-ophthalmologist (S.A.N.) Test Procedure RBP has been described in detail elsewhere (7); software can be obtained from lars.frisen@neuro.gu.se. It utilizes a dark background and briefly exposed high-contrast probes or points. These test points are shown simultaneously for 200 milli-seconds and consist of 2 microdots separated by 4 angle and measuring one half the minimum angle of resolution in di-ameter (1/100th the size of the test point in SAP). The paired dots appear randomly within 20 peripheral rectangular areas (0.5-m test distance) and 4 central areas (1-m test distance) inside 30 angle of eccentricity. Each of the 24 rectangular positions is probed twice for each pass, and the minimum of 5 passes for each test is utilized, resulting in 10 presentations per area. Ten percent of the test points consisted of one or no dots that serve as control. The target and background lumi-nances are set at 150 cd/m2 and 1 cd/m2, respectively. The results of RBP consist of the MHR (sum of microdots seen divided by sum of microdots shown), number of locations with less than a 90% hit rate and percent miss rates for each of the 24 rectangular areas tested. Results also include a topo-graphic display of the visual field for each eye (2,7,12). RBP utilizes a personal computer with a 15$ LCD dis-play. The pupils are undilated, and a correction of 2 diopters (D) at the 0.5-m test distance and 1 D at the 1.0-m distance is made. A patch is used to test each eye separately. In this study, the subject's bed was elevated to 45 angle, and the laptop was placed on a Mayo table at eye level. The subjects used a computer mouse to indicate a response. As mouse position is irrelevant for this testing, it was held on the subject's lap or hand. Lights were turned off, and window blinds were closed to minimize glare. The subjects received instructions on the test procedure and were shown a test demonstration before starting. A questionnaire was answered on completion of testing. RESULTS The analysis included the visual fields of 29 eyes from 15 subjects. There were 4 men and 11 women, ranging in age from 20 to 63 years. RBP and SAP were analyzed and classified separately and randomly. Visual field defect classifications, chosen from a list, included arcuate, altitu-dinal, central scotoma; left or right homonymous; ceco-central scotoma; diffuse depression; enlarged blindspot; bitemporal; and normal. Corresponding RBP and SAP visual fields were then compared side by side to determine whether defects were correlated. Figures 1-3 demonstrate some examples of RBP and the corresponding SAP. Figure 1 is of a 53-year-old woman with optic neuropathy of unknown etiology and visual acuity of 20/20 in the right eye and 20/15 in the left eye. Visual fields showed an inferior arcuate defect in the right eye and a superior arcuate defect in the left eye. The patient had asymmetric nerve fiber layer thinning on optical coherence tomography. Figure 2 is of a 58-year-old woman who presented with an ischemic stroke. Visual fields illustrate a dense right homonymous hemianopia. Figure 3 is of a 22-year-old man with a left frontal glioma who presented with the acute onset of seizures. Visual acuity was 20/20 in both eyes, and ophthalmoscopy showed bilateral papilledema. Visual fields disclosed enlarged blind spots. There was correspondence between RBP and SAP in 21 (72%) of 29 visual fields. RBP detected a defect in 5 (17%) of 29 visual fields in which SAP was normal. SAP detected 2 defects not detected by RBP. One visual field defect did not show correspondence between the 2 tests. RBP showed diffuse depression in 3 visual fields that was not detected with SAP. RBP test time averaged 4 minutes and 48 seconds per visual field; SAP test time averaged 3 minutes and 16 seconds. Table 2 displays subject demographics, diagnosis, and visual field classifications. TABLE 1. Normal values of rarebit perimetry Author Age, Mean (Range) MHR Range Number of Locations , 90% Range Effect of Age on MHR Frise´n 2002 (7) 27 (20-70) 96% 88-100 0.1%/y Martin and Wagner 2004 (10) 54 (17-88) 97% (95% CI = 94.5-96.7) 78-100 3 (95% CI = 2.7-4.6) 0-18 - Martin 2005 (11) 21 (6.5-12) 93% (95% CI = 90-95) 78-100 5 (95% CI = 4-9) 0-21 - Martin 2005 (11) 30 (14-20) 97% (95% CI = 96-98) 89-100 2 (95% CI = 2-4) 0-10 - Brusini 2005 (2) 41 (35-72) 88.6% (SD = 4.8%) 78-98 9 (SD = 4.2%) 1-21 0.15%/y Salvetat 2007 (12) 71 (24-79) 91.3% (95% CI = 80-98.2) 78-99 5.7 (95% CI = 0-15.6) 0-21 0.21%/y CI, confidence interval; MHR, mean hit rate; SD, standard deviation. Original Contribution 244 Houston et al: J Neuro-Ophthalmol 2010; 30: 243-247 Copyright © North American Neuro-ophthalmology Society.Unauthorized reproduction of this article is prohibited. In completing the questionnaire regarding the ease and convenience of testing with both RBP and SAP, subjects used a scale of 1 (easy) to 5 (difficult). They were then asked which test they preferred. Despite the fact that RBP test time was slightly longer than SAP test time, all 15 subjects preferred RBP because it was more convenient. But they agreed that the ease of the testing was the same for RBP and SAP. DISCUSSION In this study, RBP was comfortably carried out at the bedside. Testing conditions could be accommodated to the subject. The mouse facilitated testing as it only required the function of one finger, eliminating the need to be able to grip a device. The laptop computer was easily portable, fitting nicely in a carrying case or backpack. RBP produced results comparable to those of SAP, with 72% of visual fields exhibiting corresponding defects. Five visual fields (17%) showed defects on RBP that were not evident on SAP, consistent with the increased sensitivity of RBP in detecting subtle damage. However, 3 visual fields performed by RBP showed diffuse depression, potentially masking defects. Although RBP test times were slightly longer than SAP test times, when transportation time and clinic wait time is included, RBP is much less time consuming. Moreover, RBP, unlike SAP, is applicable to subjects who are medically unstable, need continuous monitoring, or have multiple access lines or monitors. The disadvantage of RBP is the use of suprathreshold testing, which may produce excess noise. On SAP, the problem of diffuse depression is resolved by analyzing the pattern deviation, which sets the 7th highest value (85th percentile best point) as a new baseline sensitivity (1). RBP does not have a built-in algorithm to account for diffuse depression, and some subtle defects may be lost. However, studies have shown that the effectiveness of suprathreshold testing is comparable to that of full-threshold testing (15). RBP also differs from SAP in that the fixation target moves, a feature that may promote subject confusion. However, our subjects reported that the moving fixation target helped maintain attention. Moving fixation targets have not altered diagnosis in other studies (16). There have been questions regarding the reliability of RBP as compared with SAP. Studies by Brusini et al (2) and Gedik et al (13) have shown that the MHR and mean deviation were strongly correlated. However, further studies will need to be performed to investigate the reproducibility and utility of RBP in tracking visual defects over time. FIG. 1. A patient with bilateral optic neuropathy. Rarebit perimetry (top) and standard automated perimetry (bottom) show corresponding arcuate defects in both eyes. Original Contribution Houston et al: J Neuro-Ophthalmol 2010; 30: 243-247 245 Copyright © North American Neuro-ophthalmology Society.Unauthorized reproduction of this article is prohibited. FIG. 2. A patient with left occipital lobe infarction. Rarebit perimetry (top) and standard automated perimetry (bottom) reveal a right homonymous hemianopia. FIG. 3. A patient with increased intracranial pressure from a frontal lobe glioma. Rarebit perimetry (top) and standard automated perimetry (bottom) show enlargement of the blind spot in each eye. Original Contribution 246 Houston et al: J Neuro-Ophthalmol 2010; 30: 243-247 Copyright © North American Neuro-ophthalmology Society.Unauthorized reproduction of this article is prohibited. ACKNOWLEDGMENT The authors would like to thank Dr. Lars Frise´n from the Institute of Neuroscience and Physiology, Go¨teborg Uni-versity, Sweden, for supplying the rarebit perimetry visual field program for the study. REFERENCES 1. Anderson DR, Patella VM. Automated Static Perimetry, 2nd edition. St. Louis, MO: Mosby, 1999. 2. Brusini P, Salvetat ML, Parisi L, Zeppieri M. Probing glaucoma visual damage by rarebit perimetry. Br J Ophthalmol. 2005;89:180-184. 3. Curcio CA, Owsley C, Skalka HW, Peters GE, Callahan MA, Long JA. Topography of retinal cells and visual sensitivity in the same human eyes [abstract]. Invest Ophthalmol Vis Sci. 1993;34:777. Abstract no. 375. 4. Harwerth RS, Carter-Dawson L, Shen F, Smith EL, Crawford LJ. Ganglion cell losses underlying visual field defects from experimental glaucoma. Invest Ophthalmol Vis Sci. 1999;40: 2242-2250. 5. Kerrigan-Baumrind LA, Quigley HA, Pease ME, Kerrigan DF, Mitchell RS. Number of ganglion cells in glaucoma eyes compared with threshold visual field tests in the same persons. Invest Ophthalmol Vis Sci. 2000;41:741-748. 6. Quigley HA, Dunkelberger GR, Green WR. Retinal ganglion cell atrophy correlated with automated perimetry in human eyes with glaucoma. Am J Ophthalmol. 1989;107:453-464. 7. Frise´n L. New, sensitive window on abnormal spatial vision: rarebit probing. Vision Res. 2002;42:1931-1939. 8. Frise´n L. High-pass resolution perimetry and age-related loss of visual pathway neurons. Acta Ophthalmol. 1991;69: 511-515. 9. Schiefer U, Dietrich BN, Selig B, Hoffman C, Schiller J. Angioscotoma detection with fundus-oriented perimetry. A study with dark and bright stimuli of different sizes. Vision Res. 1999;39:1897- 1909. 10. Martin L, Wanger P. New perimetric techniques. A comparison between rarebit and frequency doubling technology perimetry in normal subjects and glaucoma patients. J Glaucoma. 2004;13:268-272. 11. Martin L. Rarebit and frequency-doubling technology perimetry in children and young adults. Acta Ophthalmol Scand. 2005;83:670-677. 12. Salvetat ML, Zeppieri M, Parisi L, Brusini P. Rarebit perimetry in normal subjects: test-retest variability, learning effect, normative range, influence of optical defocus, and cataract extraction. Invest Ophthalmol Vis Sci. 2007;48:5320-5331. 13. Gedik S, Akman A, Akova YA. Efficiency of rarebit perimetry in the evaluation of homonymous hemianopia in stroke patients. Br J Ophthalmol. 2007;91:1065-1069. 14. Keltner JL, Johnson CA. Screening for visual field abnormalities with automated perimetry. Surv Ophthalmol. 1983;28:175-183. 15. Siatkowski RM, Lam BL, Anderson DR, Feuer WJ, Halikman AM. Automated suprathreshold static perimetry screening for detecting neuro-ophthalmologic disease. Ophthalmology. 1996;103:907-917. 16. Reitner A, Tittl M, Ergun E, Baradaran-Dilmaghani R. The efficient use of perimetry for neuro-ophthalmic diagnosis. Br J Ophthalmol. 1996;80:903-905. TABLE 2. Patient demographics, diagnosis, and visual field classification Diagnosis Age Sex RBP (OD:OS) SAP (OD:OS) Pituitary mass 51 F Normal:arcuate Normal:arcuate Ocular hypertension 49 F Normal:normal Normal:normal Optic neuropathy 53 F Arcuate:arcuate Arcuate:arcuate Ocular ischemic syndrome 59 M Diffuse depression Diffuse depression Subarachnoid hemorrhage 55 M Left homonymous:left homonymous Left homonymous:left homonymous Aneurysm 40 F Arcuate:arcuate Normal:normal Pseudotumor cerebri 20 F Diffuse depression:diffuse depression Diffuse depression:diffuse depression Meningioma 54 F Diffuse depression:arcuate Arcuate:normal Visual changes 47 F Normal:arcuate Normal:arcuate Glaucoma 63 F Normal:arcuate Normal:cecocentral scotoma Orbital tumor 50 M Normal:normal Normal:normal Stroke 58 F Right homonymous:right homonymous Right homonymous:right homonymous Pseudotumor cerebri 22 F Diffuse depression:arcuate Diffuse depression:diffuse depression Cerebral tumor 22 M Enlarged blindspot:enlarged blindspot Enlarged blindspot:enlarged blindspot Aneurysm 30 F Arcuate:arcuate Normal:normal OD, right eye; OS, left eye; RBP, rarebit perimetry; SAP, standard automated perimetry. Original Contribution Houston et al: J Neuro-Ophthalmol 2010; 30: 243-247 247 Copyright © North American Neuro-ophthalmology Society.Unauthorized reproduction of this article is prohibited. |