| OCR Text |
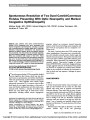
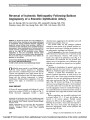
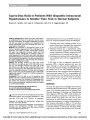
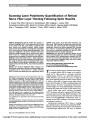
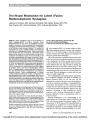
Show Cup-to-Disc Ratio in Patients With Idiopathic Intracranial Hypertension Is Smaller Than That in Normal Subjects Brooke E. Geddie, DO, Ugur E. Altiparmak, MD, Eric R. Eggenberger, DO Abstract: Background: A small cup-to-disc (C:D) ratio is an established risk factor for nonarteritic anterior ische-mic optic neuropathy. We sought to determine if a small C:D ratio was present in patients with idiopathic intra-cranial hypertension (IIH) as a potential risk factor for visual loss in that disorder. Methods: We performed a retrospective review of 52 charts of patients diagnosed with IIH at Michigan State University from 1990 to 2003. Twenty-eight patients (55 eyes) met diagnostic inclusion criteria and had undergone fundus photography of sufficient quality to allow assessment of the C:D ratio after optic disc edema had become minimal or resolved. C:D ratio was measured from the digitized photographs. The data were placed into rank order categories (0.1 unit intervals) and compared to published normative C:D data. Results: The average vertical C:D ratio was 0.143 (SD 0.061) in the right eye and 0.127 (SD 0.056) in the left eye. The average horizontal C:D ratio was 0.145 (SD 0.053) in the right eye and 0.133 (SD 0.053) in the left eye. The IIH group rank distribution data were com-pared to published normative C:D ratio data (chi-square test). In each case, the IIH population had a statistically significantly smaller C:D ratio (P , 0.0001) compared to normal subjects. Conclusions: The C:D ratio in our IIH population was smaller than that in published control populations. A small C:D ratio may lower the threshold for developing optic disc edema from ischemia, increased intracranial pres-sure, or other mechanisms. Additional studies are needed to confirm these findings. Journal of Neuro-Ophthalmology 2010;30:231-234 doi: 10.1097/WNO.0b013e3181dee8c6 2010 by North American Neuro-Ophthalmology Society Aconsistent risk factor for the development of nonarteritic anterior ischemic optic neuropathy (NAION) is a small cup-to-disc (C:D) ratio (1-5). However, the pathogenic relationship between the C:D ratio and NAION remains un-clear (1-5). Proposed mechanisms include the following (6): 1. Crowding causes axonal swelling secondary to me-chanical obstruction to axoplasmic flow, particularly at the most crowded region, the lamina cribrosa. 2. Subclinical ischemia due to lipohyalinosis and/or other factors produces axoplasmic stasis, with swelling causing compression and further compromise of the microcirculation in the crowded laminar region. 3. Crowding may be associated with an abnormally stiff (less compliant) lamina cribrosa, exaggerating factors 1 and 2. In this study, we focus on idiopathic intracranial hy-pertension (IIH), a disorder associated with optic disc edema. Although it is well known that papilledema is the result of axonal transport blockage, the pathophysiology of this cellular event is not well understood. Hayreh (7) speculated that the cause is mechanical from transmission of raised intracranial pressure (ICP) to retinal ganglion cell axons in the optic nerve. Our hypothesis is that an optic disc with a small C:D ratio may be more likely to swell from increased ICP, much as it appears to be a risk factor for NAION. METHODS The study was approved by the Michigan State University Institutional Review Board (03-073). We performed a chart review of 52 consecutive patients from the Michigan State University Department of Neurology and Ophthalmology with a diagnosis of IIH from 1990 to 2003. Inclusion cri-teria (8) were signs and symptoms of elevated ICP, docu-mented elevated ICP greater than 250 mm of water (measured in the lateral decubitus position), normal cere-brospinal fluid composition, no evidence of hydrocephalus or other structural abnormality on MRI or CT, and docu-mented optic disc photographs of sufficient quality at a point in time with minimal or resolved optic disc edema (Frise´n stage 0-2) (9) to allow accurate assessment of the C:D ratio. Department of Neurology and Ophthalmology, Michigan State University, East Lansing, Michigan. Address correspondence to Eric R. Eggenberger, DO, Department of Neurology and Ophthalmology, Michigan State University, 138 Service Road, A217 Clinical Center, East Lansing, MI 48824; E-mail: Eric.Eggenberger@ht.msu.edu Geddie et al: J Neuro-Ophthalmol 2010; 30: 231-234 231 Original Contribution Copyright © North American Neuro-ophthalmology Society.Unauthorized reproduction of this article is prohibited. Optic disc photographs were digitized to allow computer magnification of the optic disc (200%) and use of a pixel-measuring program (Microsoft Photo Editor) to quantify the C:D ratio. The vertical and horizontal diameter of the optic disc and cup were analyzed by one observer (B.E.G.). The diameter of the cup was divided by the diameter of the disc to derive the C:D ratio (Fig. 1). Measurements were repeated 1 month later with the observer masked to previous data for a total of 2 results per eye, which were then averaged for statistical analysis. Random confirmation was performed by a second observer (E.R.E.). The IIH study patient C:D data were tabled in rank order categories encompassing 0.1 unit intervals. The data were then compared to published normative data. For each comparison, statistical significance was assessed with the P value determined by the chi-square test. RESULTS Of the 52 charts reviewed, 28 patients (55 eyes; 28 right and 27 left) met inclusion criteria. Among the study cohort, 96.4%(27 subjects) were women, 82.1% (23 subjects) were white, and 17.9% (5 subjects) were African American. The average age of the study patients was 28.6 (SD, 8.2) years. The average body mass index was 35.7 (SD, 6.8). The presenting visual symptoms included blurred vision in 39.3% (11 subjects), transient visual obscurations in 21.4% (6 patients), nausea and vomiting in 14.3% (4 patients), changes in peripheral vision in 10.7%(3 patients), diplopia in 25.0% (7 patients), and tinnitus in 21.4% (6 patients). Headache was reported in all patients, with 46.4% (13 subjects) characterizing the headache as generalized. The initial neuro-ophthalmic evaluation in all 28 subjects included visual acuity, pupil size and reactivity, Hardy-Rand- Rittler pseudoisochromatic color plate testing, ocular motility and alignment measurements, kinetic visual fields, biomicroscopy, and ophthalmoscopic examinations. Best-corrected visual acuity at presentation was 20/25 or better in 47 eyes (85.5%), 20/40 or better in 53 eyes (96.4%), and worse than 20/40 in 2 eyes (3.6%). Color vision was normal (90% or better) in 45 eyes (81.8%). Initial kinetic visual field results included 18.2% (10 eyes) with full visual fields without deficits, 50.9% (28 eyes) with enlarged blind spots only, 9.1% (5 eyes) with enlarged blind spots and global constriction, 10.9% (6 eyes) with global constriction only, and 10.9% (6 eyes) with arcuate visual field defects. All 28 subjects underwent lumbar puncture at the time of the initial diagnostic evaluation. The average opening pres-sure was 369 mm (SD, 93.6 mm) of water. Brain MRI was performed in 92.9% (26 subjects) and revealed a partially FIG. 1. Calculation of the cup-to-disc ratio. TABLE 1. Horizontal cup-to-disc (C:D) ratio data from our patients compared with 4 published studies of normal subjects C:D Ratio Normal Subjects of Kroninger and Newcomb (10), % (n) Normal Subjects of Kragha (11), % (n) Normal Subjects of Leibowitz et al (12), % (n) Normal Subjects of Armaly and Sayegh (13), % (n) Our Study, % (n) 0 - 1.7 (23) 10.9 (550) 18 (444) - 0.1 38.8 (646) 9.54 (129) 14.7 (745) 23.5 (579) 56.36 (31) 0.2 20.7 (345) 19 (257) 26.7 (1349) 23 (567) 40.0 (22) 0.3 18.5 (308) 44.45 (601) 26.5 (1340) 19.5 (481) 3.64 (2) 0.4 11.6 (193) 13.9 (188) 11.5 (582) 7.5 (185) - 0.5 7.2 (120) 7.32 (99) 4.7 (236) 4.5 (111) - 0.6 2.1 (35) 2.37 (32) 3.0 (154) 2.5 (62) - 0.7 1.0 (17) 0.96 (13) 1.4 (71) 1.5 (37) - 0.8 - 0.67 (9) 0.36 (18) - - 0.9 - 0.07 (1) 0.08 (4) - - 1.0+ - - 0.08 (4) - - Original Contribution 232 Geddie et al: J Neuro-Ophthalmol 2010; 30: 231-234 Copyright © North American Neuro-ophthalmology Society.Unauthorized reproduction of this article is prohibited. empty sella in 30.8% (8 subjects).CTwas performed in 7.1% (2 subjects), yielding normal results. Test-retest correlation (observer B.E.G.) for the hori-zontal and vertical C:D ratio was 0.97, with the average value of the 2 observations used in the analysis. The average vertical C:D ratio of IIH study eyes was 0.143 (SD, 0.061) in the right eye and 0.127 (SD, 0.056) in the left eye. The average horizontal C:D ratio of IIH study eyes was 0.145 (SD, 0.053) in the right eye and 0.133 (SD, 0.053) in the left eye. The rank distribution of horizontal, vertical, and average C:D data (0.1 intervals) was compared to appropriately matched normative data (Tables 1-3) using the chi-square test. As shown in Table 1 and Figure 2, the difference be-tween the C:D ratio in IIH study eyes and the horizontal C:D ratio from normative data compiled by Kroninger and Newcomb (10), Kragha (11), Leibowitz et al (12), and Armaly and Sayegh (13) was statistically significant (P , 0.0001) as was the difference between the vertical C:D ratio of our IIH study eyes and the normative data from Lei-bowitz et al (12) (Fig. 3) (P , 0.0001). For the average horizontal and vertical C:D ratio, our IIH eyes differed significantly (P , 0.001) from a normative frequency distribution ratio (Table 3 and Fig. 4) (14). Given the C:D correlation between right and left eyes, statistical analysis was repeated using a sample of 28 patients, yielding the same results. DISCUSSION A small C:D ratio was a frequent finding in our IIH pop-ulation and was more frequent than in published control populations. A small C:D ratio may lower the threshold for optic disc edema from any of several insults, including is-chemia or increased ICP. The small C:D ratio may lead to diminished compensatory reserve for axoplasmic flow stasis in the setting of elevated ICP. The optic disc with a small C:D ratio may be more likely to exhibit optic disc edema compared to optic discs with larger C:D ratios. The limitations of this study include the measurement of C:D ratio after resolution or near-resolution of optic disc edema. Based on the Frise´n staging scheme (9), stage 3 optic disc edema involves increased diameter of the nerve head and stage 4 optic disc edema involves compression or obliteration of the optic cup. Because of this confounding factor, only TABLE 2. Vertical cup-to-disc (C:D) ratio data from our patients in comparison to published study of normal subjects by Leibowitz et al (12) C:D Ratio Normal Subjects of Leibowitz et al (12), % (n) Our Study, % (n) 0 10.8 (546) 1.82 (1) 0.1 15.3 (775) 61.82 (34) 0.2 25.4 (1282) 32.73 (18) 0.3 25.4 (1281) 3.64 (2) 0.4 12.3 (619) - 0.5 5.2 (261) - 0.6 3.3 (168) - 0.7 1.8 (89) - 0.8 0.4 (20) - 0.9 0.12 (6) - 1.0+ 0.12 (6) - TABLE 3. Average horizontal and vertical cup-to-disc (C:D) ratio data from our patients in comparison to published study of normal subjectsbyBecket al (14) C:D Ratio Normal Subjects of Beck et al (14), % (n) Our Study, % (n) 0.0-0.09 4 (16) 21.82 (12) 0.10-0.19 12.5 (50) 67.27 (37) 0.20-0.29 30.75 (123) 9.09 (5) 0.30-0.39 25.5 (102) 1.82 (1) 0.40-0.49 13.75 (55) - 0.50-0.59 10.25 (41) - 0.60-0.69 2.5 (10) - 0.70-0.79 0.75 (3) - 0.80-0.89 - - 0.90-0.99 - - FIG. 2. Horizontal cup-to-disc ratio data from our study compared to normative data from previously published studies. Original Contribution Geddie et al: J Neuro-Ophthalmol 2010; 30: 231-234 233 Copyright © North American Neuro-ophthalmology Society.Unauthorized reproduction of this article is prohibited. those IIH eyes with Frise´n stage 0 to 2 (minimal or resolved edema) were included in this study. One might question the possibility of a permanent change in C:D ratio from pap-illedema. While optic disc excavation and increased cup area has been reported with certain optic neuropathies (4), we are unaware of studies demonstrating a diminution of the C:D ratio. Further data collection and analysis of a larger cohort of patients with IIH and an appropriate group of controls would be beneficial to further evaluate these preliminary results. In addition, studies in population sets with optic disc edema from other nonischemic causes would be useful to understand the potential role of optic nerve structure in the pathophysiology of optic disc edema. REFERENCES 1. Beck RW, Savino PJ, Repka MX, Schatz NJ, Sergott RC. Optic disc structure in anterior ischemic optic neuropathy. Ophthalmology. 1984;91:1334-1337. 2. Feit RH, Tomsak RL, Ellenberger C Jr. Structural factors in the pathogenesis of ischemic optic neuropathy. Am J Ophthalmol. 1984;98:105-108. 3. Beck RW, Servais GE, Hayreh SS. Anterior ischemic optic neuropathy. IX. Cup-to-disc ratio and its role in pathogenesis. Ophthalmology. 1987;94:1503-1508. 4. Jonas JB, Gusek GC, Naumann GO. Anterior ischemic optic neuropathy: nonarteritic form in small and giant cell arteritis in normal sized optic discs. Int Ophthalmol. 1988;12: 119-125. 5. Doro S, Lessell S. Cup-disc ratio and ischemic optic neuropathy. Arch Ophthalmol. 1985;103:1143-1144. 6. Arnold AC. Pathogenesis of nonarteritic anterior ischemic optic neuropathy. J Neuro-Ophthalmol. 2003;23:157-163. 7. Hayreh SS. Optic disc edema in raised intracranial pressure: v. pathogenesis. Arch Ophthalmol. 1977;95: 1553-1565. 8. Friedman DI, Jacobson DM. Diagnostic criteria for idiopathic intracranial hypertension. Neurology. 2002;59: 1492-1495. 9. Frise´n L. Swelling of the optic nerve head: a staging scheme. J Neurol Neurosurg Psychiatry. 1982;45:13-18. 10. Kroninger DL, Newcomb RD. Clinical investigation of the cup/disc ratio. J Am Optom Assoc. 1984;55:54-57. 11. Kragha IK. Characteristics of the optic disc cup. Am J Optom Physiol Opt. 1985;62:195-202. 12. Leibowitz HM, Krueger DE, Maunder LR, Milton RC, Kini MM, Kahn HA, Nickerson RJ, Pool J, Colton TL, Ganley JP, Loewenstein JI, Dawber TR. The Framingham eye study monograph; an ophthalmological and epidemiological study of cataract, glaucoma, diabetic retinopathy, macular degeneration and visual acuity in a general population of 2631 adults, 1973-1975. Surv Ophthalmol. 1980; 24(Suppl):335-610. 13. Armaly MF, Sayegh RE. The cup-disc ratio; the findings of tonometry and tonography in the normal eye. Arch Ophthalmol. 1969;82:191-196. 14. Beck RW, Messner DK, Musch DC, Martonyi CL, Lichter PR. Is there a racial difference in physiologic cup size? Ophthalmology. 1985;92:873-876. FIG. 3. Vertical cup-to-disc ratio data from our study compared to normative data from Leibowitz et al (12). FIG. 4. Average horizontal and vertical cup-to-disc ratio data fromour study compared to normative data fromBeck et al (14). Original Contribution 234 Geddie et al: J Neuro-Ophthalmol 2010; 30: 231-234 Copyright © North American Neuro-ophthalmology Society.Unauthorized reproduction of this article is prohibited. |