| OCR Text |
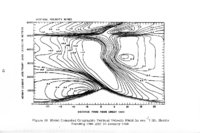
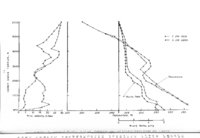
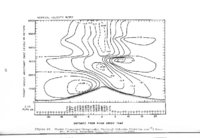
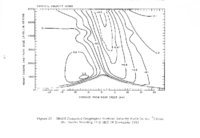
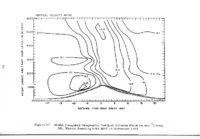
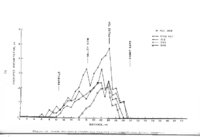
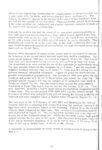
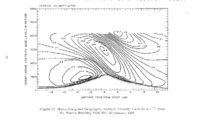
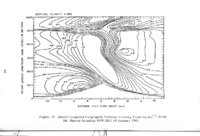
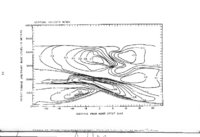
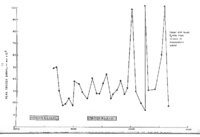
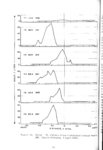
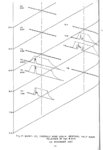
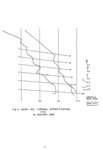
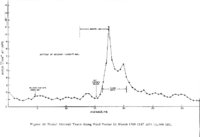
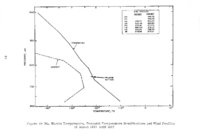
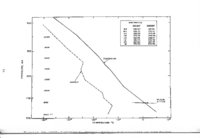
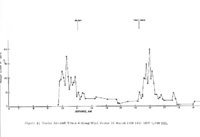
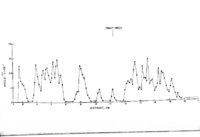
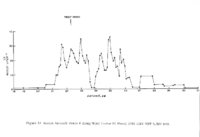
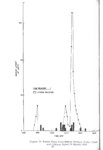
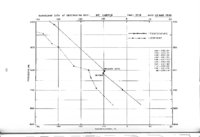
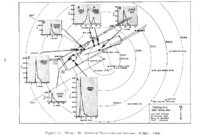
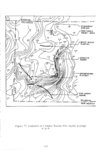
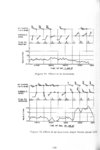
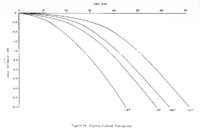
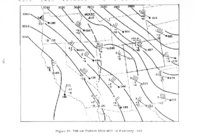
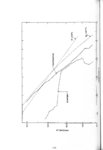
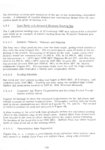
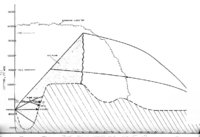
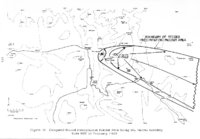
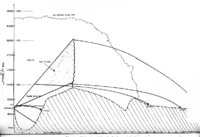
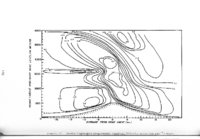
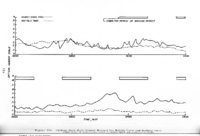
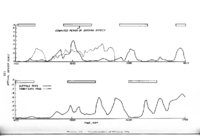
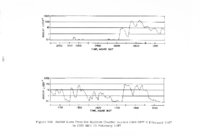
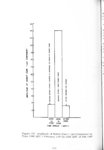
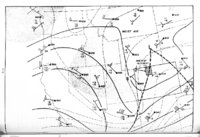
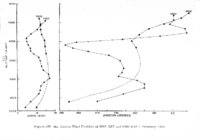
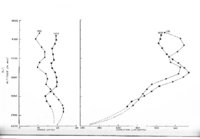
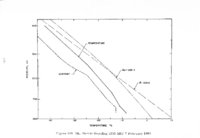
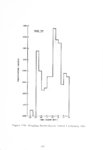
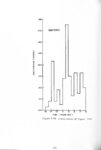
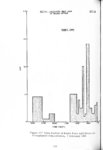
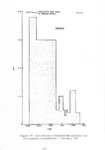
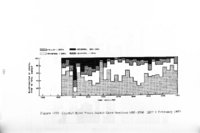
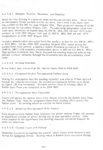
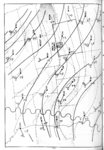
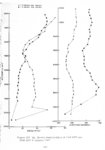
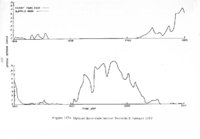
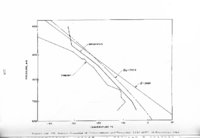
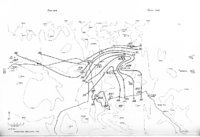
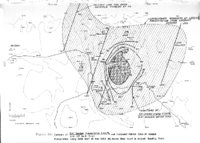
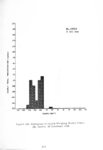
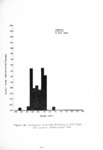
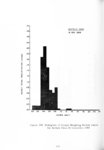
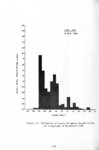
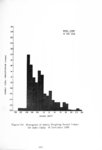
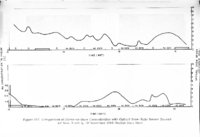
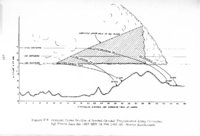
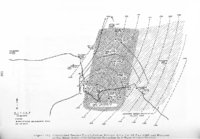
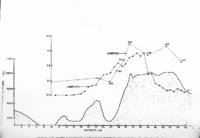
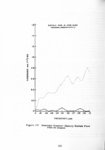
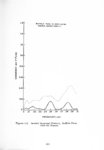
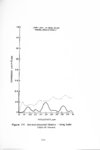
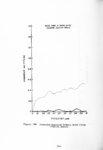
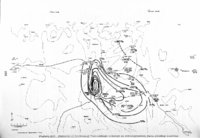
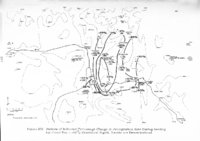
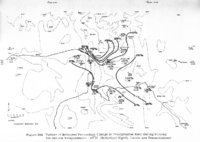
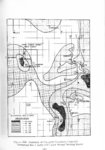
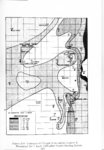
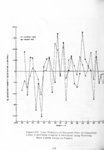
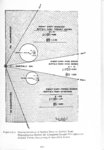
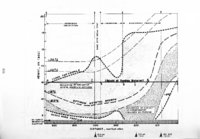
Show LIST OF FIGURES (CONTINUED) Title Figure Isohyetal Map for 3-hour Period 1000-1300 MST, 16 Nov. 1968, Using Weighing Bucket Network Data. Contour interval 0. 05 in. Unseeded Block (Mt. Harris Release) AP No. 5 223 Isohyetal Map for 3-hour Period 1300-1600 MST, 16 Nov. 1968, Using Weighing Bucket Network Data. Contour Interval 0. 05 in. Unseeded Block (Mt.· Harris Release) AP No. 6 224 Isohyetal Map for 3-hour Period 1600-1900 MST, 16 Nov. 1968, Using Weighing Bucket Network Data. Contour Interval 0. 05 in. Seeded Block (Aircraft Pyrotechnic Drops) AP. No. 6 225 d 3 hr Seeded Precipitation x 100% an 6 hr AP No. 5 Total Computed Fallout Zone of Seeded Precipitation Using 0749 MST, 16 Nov. 1968, Mt. Harris Sounding & Winds Aloft 226 d 3 hr Seeded Precipitation x 100% an 6 hr AP No. 6 Total Computed Fallout Zone of Seeded Precipitation Using 1549 MST 16 Nov. 1968 Mt. Harris Wind Aloft & Aircraft Seeding Track 227 142 Mt. Harris Winds Aloft Profiles 16 November 1968 228 143 Lodwick Vertical Pointing Radar AGC Voltage TimeHeight Section 16 November 1968 230 144 Continuation of Figure 143 231 145 Continuation of Figures 143 and 144 232 146 Histogram of Hourly Weighing Bucket Totals, Mt. Harris, 16 November 1968 233 147 Histogram of Hourly Weighing Bucket Totals for Emerald Mountain, 16 November 1968 148 Histogram of Hourly Weighing Bucket Totals for Lodwick, 16 November 1968 137 138 139 140 141 C ont ours C ont ours Of Of 378 235 |