| OCR Text |
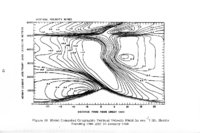
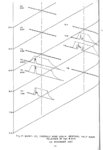
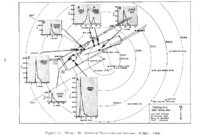
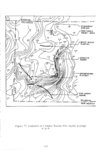
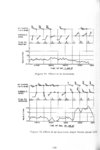
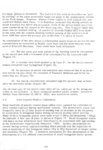
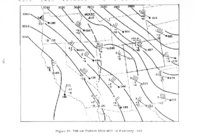
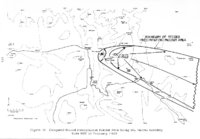
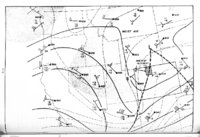
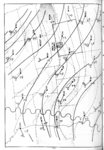
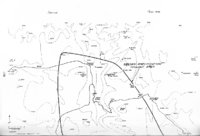
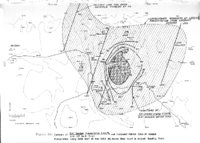
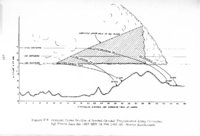
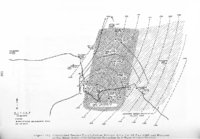
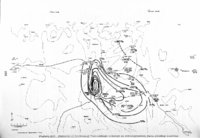
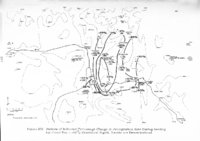
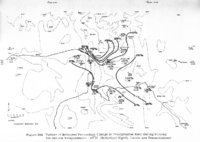
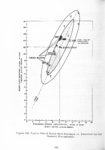
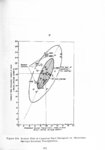
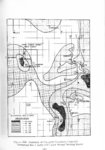
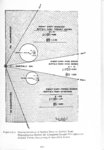
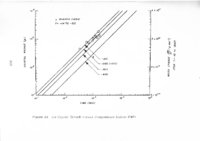
Show the Pass station further east, on the flat ridge at Maintenance Camp. is the only time that this happened during the five years of record. 5. 5. 2 This Precipitation Gauge Data Precipitation data from a series of weighing bucket gauges in target and nearby areas were collected for the 1966-67 and 1967-68 winter seasons; these data give storm total precipitation and are useful for 'c omparison with snow course and snow board data. The target area extends from about 10 miles northeast to 10 miles southeast of the Emerald Mountain seeding site. Since there is a wide range of transport wind velocities during seeding tests, there will be times when one end of the target area is being seeded while the opposite end is unaffected. Ratios of precipitcJ.tion data, from gauges at either end of the target area, were plotted against prevailing wind direction for these periods. Because there is a natural variation of ratios with wind direction, which acts in the same way as a positive seeding effect, it was necessary to take into account the wind speed and a model of Agl plume trajectory to obtain a potentially useful evaluation technique. The data chosen for ratio formation were 4-hour totals from weighing buckets during the 83 periods for which Mt. Harris upper-air winds and Emerald Mountain 100 ft. tower winds were available. The plume trajectory model assumed that it takes 40 minutes from release time for adequate vertical diffusion of the Agl, subsequent crystal growth, and fallout as precipitation. It was also assumed that the Mt. Harris 11, 000 ft. MSL wind and the Emerald Mountain 100 ft. tower wind exert equal influences on the trajectory of the seeding material. The 4-hour vector averages of the Mt. Harris and Emerald Mountain winds were computed and averaged; the 40 minute travel from Emerald Mountain (plotted in polar coordinates) then described the probable location of greatest seeding effect. At each of these points, the ratio increased as the wind veered from SW to NW. In an attempt to separate seeding effects from natural effects, circles of two and three nautical mile radius were drawn about Rabbit Ears and Buffalo Pass, respectively, and the mean ratios within these circles were compared to the mean ratios of the remaining occurrences in the direction sector from which the circle was cut. Figure 213 displays this procedure pictorially. The Buffalo Pass circle is larger than the Rabbit Ears circle because of its lower data density. Statistical testing of the results for significance indicated a positive seeding effect within the Rabbit Ears circle, significant at the 15% level, and within 310 |