| OCR Text |
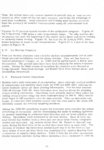
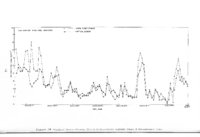
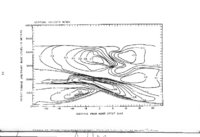
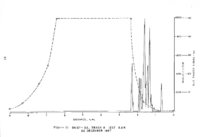
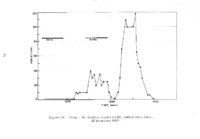
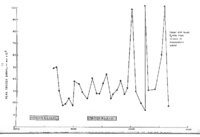
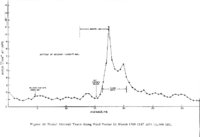
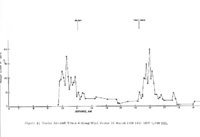
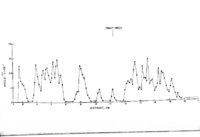
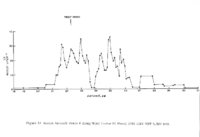
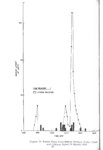
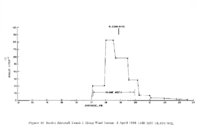
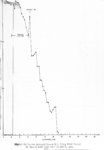
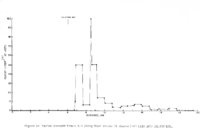
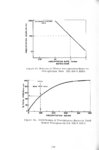
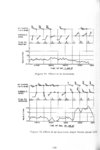
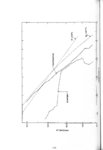
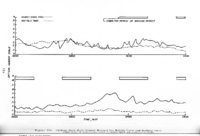
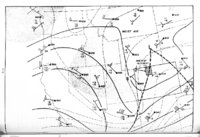
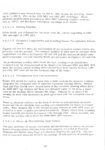
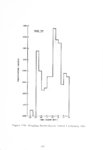
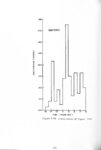
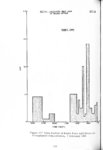
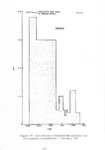
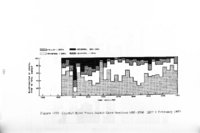
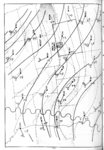
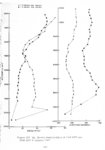
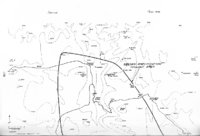
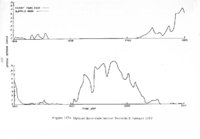
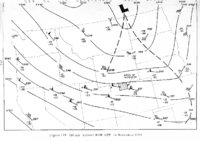
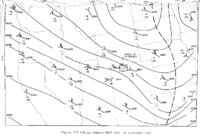
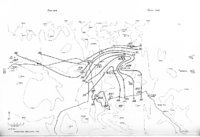
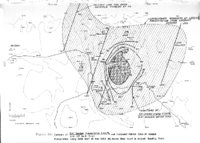
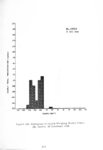
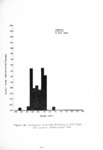
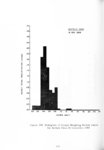
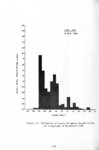
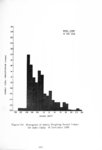
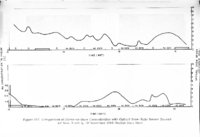
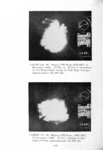
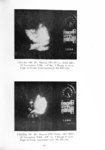
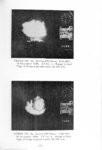
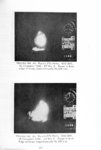
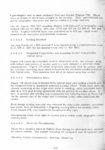
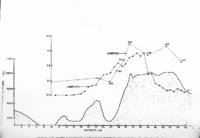
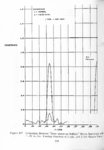
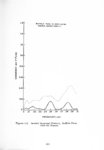
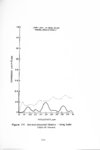
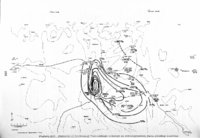
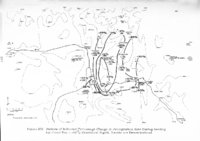
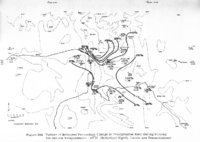
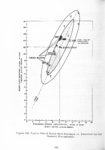
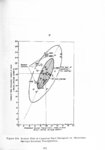
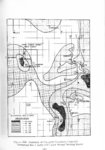
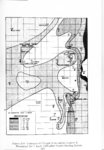
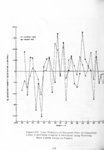
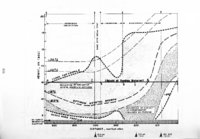
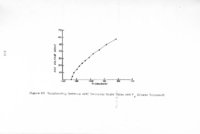
Show 4. 5. 4. 1. 8 Time Comparison of AAS Silver-in-Precipitation Concentration from Rabbit Ears Optical Snow Rate Sensor To obtain additional insight as to whether the observed snowrate increases in the weighing bucket data were caused by Agl seeding, the AAS silver-inprecipitation concentration values (obtained by using 15 minute snow samples from· Rabbit Ears Pass) were studied. Relative maximum measurements were noted at 0915 to 0945 MST and 1145 to 1200 MST. The marked maximum from 0915-0945 MST is in very good agreement with the estimated time of occurrence of the main seeded precipitation over the site. Since weighing bucket recorders cannot give reliable resolution to a 15-minute period, these silver content values were plotted on the same time scale as the optical snowrate sensor record from Rabbit Ears. The resulting chart is shown in Figures 156-157. Light sensor precipitation rate maxima do occur coincident with the silver concentration maximum values. This lends credence to the idea that at least part of the precipitation rate increase was due to seeding. 4. 5. 4. 1. 9 Mt. Harris PPI Radar Photos Figures 158-171 show approximately hourly pictures of the Mt. Harris PPI scope during AP Nos. 5 and 6. While the range of detection of snow with the radar is quite limited, and in most cases does not extend quite to the Park Range crest, some inference as to the probable ridge precipitation pattern can be made from this series of photos. First, a word about interpretation. When significant snow is occurring at Mt. Harris, the scope tends to have a fuzzy appearance as in Figure 158, with definition of outlying precipitation echoes ·poorly displayed. Much better definition of outlying echoes is obtained when no precipitation is occurring at the site as in Figure 16 3. Thus, from Figures 158-163, significant snow appeared to be occurring at Mt. Harris until after 0845 MST , but th e main ec ho had moved to just south of the site by 0930 MST where it t e nd ed to stay through at least 1210 MST. At 1257 MST (Figure 164) it appeared to be snowing again at Mt. Harris, but with an east-west band which is very clearly outlined in Figure 166 at 1432 MST. This band persisted throug h 1 735 MST (Figure 170). By 1810 MST (Figure 171), the scope was almost clear. This east -west banding has been observed on several previous occasions, and although the echo was not observed as far east as the ridge, due to radar sensing limitation, a logical eastward extension of the band would place it over the southern portion of th e exp e rimental area. The isohyetal maps in F igures 13 6-13 8 support this idea. No new echoes appeared to the east of Mt. Harris following afternoon aircraft 243 |