| OCR Text |
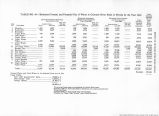
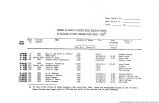
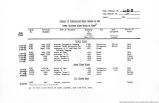
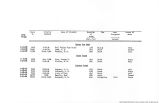
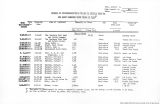
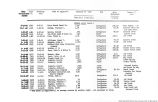
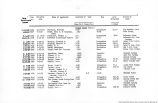
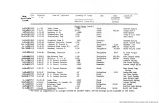
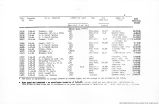
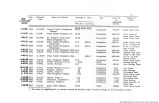
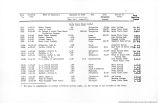
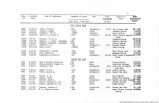
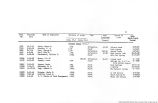
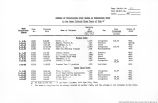
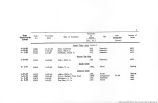
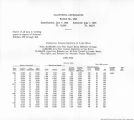
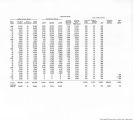
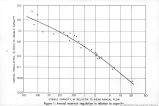
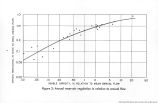
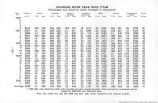
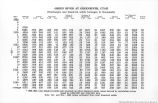
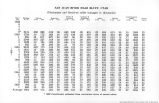
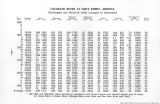
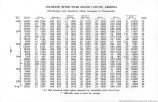
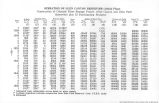
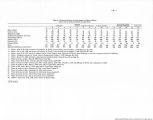
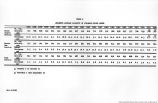
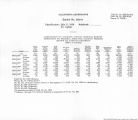
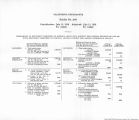
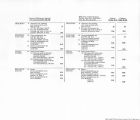
Show ¦•tar condition* during the 1021-45 period are presented primarily In the form of maps, tables and charts. Salient features are pointed out In the text, but the baalo data are given for the benefit of those lntereated In further iet«lls of annual and seasonal variations In runoff. The Maps showing the variation In runoff ever the United States and Canada for each of the 25 Tears, a prominent feature of this retort, are similar to those published currently In Water Resources Review alnce 1S40 froa advance and provisional data, and have been used to study the areal extent of regions of excessive and deficient runoff. This report alao oontalns a table of normals of monthly and annual stream flow for the representative stations used to prepare the above maps, which are figures not otherwise readily available. The Information herein presented waa computed aa easential background material for Water Resources Review ox *aa derived from auoh material. As an important criterion in the Original choice of index gaging stations was representativeness, the graphs and tables In this report are believed to present an authentic picture of annual and seasonal variations In stream flow in United States and Canada. EIPL4HATI0I OF MAPS OF AHIUAL RUNOFF The accompanying series of maps, figure 1, tpp- 3 to 15) show annual runoff in percent of normal In the United States and Canada for the water years 1921-46. They are based on records of discharge at 124 index gaging stations, of which 102 are in the United States and 22 in Canada. The Index gaging stations are identified on figure 2 and on tables 2 and 3. The cumber* shown on figure 2 refer to the gaging stations listed In these tables. Of particular interest are the lines of normal runoff and the areas of axoesslve and deflolent runoff. The median has been uaed as the normal throughout thla report, slnoe It possesses oortsln advantages for this purpose. It la an average of position. Is not affeoted by extreme values, and is oloser to the mode, or most frequent value, than is the average. The lines of normal runoff separate the regions in which runoff waa above normal from those in whloh runoff waa below normal. In many Instances different Interpretations of the data were possible, and It was sometlmss necessary to consult reoorda of flow at gaging stations other than those shown on the maps to assure the best possible Interpretation. However, It jiust be remembered that the lines of normal runoff have been generalized, and the possibility of the existence of local inconsistencies is fully reoognlsed. Stream flow at a particular gaging station for a given water year la olassad as exoesslve if the annual dlaoharge is above the upper quartlle of the frequenoy distribution and as dsficlent if below the lower quartlle. The median and both quartlles were obtained by graphloal methods to minimize the effect of irregularities oooasloned by the small number of items (from a statistical viewpoint) in the frequenoy distribution. Thus It may be expected that stream flow at a particular gaging station will be claased as axoesslve during 86 peroent of the years, aa deficient during 26 percent of the years, and aa within the normal range during 50 percent of the years.* Cross-hatohed areas on the maps are those in whloh runoff was excessive and dotted areaa those In whloh runoff was deficient. 9 9rfiHtn™EJBi FBKI Ox) In order that percentagea of normal at representative gaging station* in the same region might be comparable, a atandard reference period was considered essential. The base or referenoe period selected was the water yeara 1921 to 1945, not because of any inherent hy-drologlc significance but because it was the longest period for which stream-flow records were available,at a sufficient number of the index gaging stations. However, the 1921-45 period la believed to be reasonably represents-tlve considering the entire region, for it in* eludes the so-called "wet" yeara of 1927 and 1928 and the "dry" years of the early 1930'sJ Runoff during the 25-year period 1921-46 was notably less than during the 50-year period 1896-45 throughout moat of the United States, apparently. Although records are unavailable, it is believed that the same Is true In Canada. The trend in runoff is apparent from figure 12 (see p.35) and is further illustrated by the table below: Table 1.-Comparison of 25-year with 50-year normals at long-tei *m gaging stations. Ratio of Period Hedlan annual discharge 25-year Gaging Station of (cubic feet per second) median to record 1896-1945 1921-1945 50-year median Red River at Grand Forks, N. D. 1882- 1 880 1,150 0.61 Columbia River near The Dalles, Oreg. 1878- 190 000 165,000 .87 Mississippi River at Keokuk, Iowa 1878- 57 600 52,900 .92 kings River at Piedra, Calif. 1895- 2 220 2,070 .93 Tennessee River at or near Chattanooga , Tenn. 1.874- 35 800 34,400 .95 Busquehanna River at Harriaburg, Pa. 18C0-1BC8- 33 200 31,500 .95 (Continued on p. 27) |
| Source |
Original book: [State of Arizona, complainant v. State of California, Palo Verde Irrigation District, Coachella Valley County Water District, Metropolitan Water District of Southern California, City of Los Angeles, California, City of San Diego, California, and County of San Diego, California, defendants, United States of America, State of Nevada, State of New Mexico, State of Utah, interveners] : |


