| OCR Text |
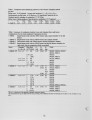
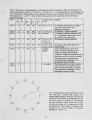
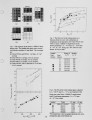
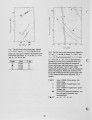
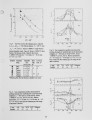
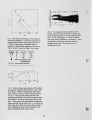
Show the lowest possible reaction temperature, namely Te. However, at Te > 1800 K they are far below the predictions of the reactor model. Lastly, w e include the results of Bindar (1996), as examined by Becker, Grandmaison, Pollard and Sobiesiak (1995), obtained operating our furnace with three non-swirl, multi-jet, commercial burners of an earlier low-NOx design. The data from Bindar are for X0 around 3 %, Ta around 400 °C and mf(-Ahc)around 300 k W , so they are directly comparable with the present results. For those burners, the dependency of N O x on Te is much flatter, and the emission levels are very much higher, than for the C G R I burner. This behaviour is typical of the earlier designs of low-NOx burners. 7.3. Gas composition fields, flame size and combustion intensity In the Series 1-XBM2-F single-burner, full-furnace trials, the gas composition field was probed from the roof access-ports and from the nearfield port which allows full traversing of the space 1.5 m long by 1.5 m wide by 1 m high (x = 0-1.5 m, y = 0-1.5 m, z = 0-1 m ) accessible from the nearfield port. The species measured were CH4, CO2, C O , O2 and N O x . The full data are given in Becker and Sobiesiak (1996). Since only the first (Bl) burner was operating, the composition field through most of the furnace was, of course, virtually flat, uniformly at the exhaust-gas level. In the complex jetting flow developing from the burner, a visibly three-dimensional field is seen, illustrated in Figs. 10 and 11 by data from horizontal traverses of the vertical mid-plane (z = 0.5 m ) taken from the nearfield port in Trial 950516. There is a tendancy for the flow to veer toward the front wall (the y = 0 plane), a natural result of the constriction of the recirculation of furnace gases on that side. The boundaries of the main combustion zone, in which practically all the heat release occurs, are delineated by the fringes of the profiles of CH4, O2 and CO2, in reasonable agreement with each other, but most sharply by the profile of C H4 because XCH drops to zero rather than to plateau values that are somewhat wobbly because of the inability of the furnace control system, which is not based on X0 as the control variable, to maintain X0 at a fully constant level. In a purely chemical sense, the combustion zone can also be viewed in terms of the virtual disappearance of C O , typically indicating a somewhat greater length of the zone but miniscule lateral increase, because laterally the boundary is constrained by the inflow of recirculating furnace gases driven by jet entrainment. There is also a problem in associating the boundary with C O at levels below those significantly affecting combustion heat release in that the cutoff criterion is highly arbitrary. W e have not, therefore, attempted in the present work to define boundaries based on C O levels. Figure 12 shows the transverse maximum of the C H 4 content as a function of distance from the burner wall for all three of the operating conditions investigated. T h e manipulated variable, as noted in §7.2.4, was the cold-sink exposure, giving exhaust-gas temperature levels of 970, 1169 and 1459 °C. The corresponding area-average refractory temperatures (external walls plus roof) were 835, 906 and 1045 °C. The range was thus from a fairly cold furnace, overall, giving marginal combustion stability for the C G R I burner, to a moderately hot furnace with excellent stability. The results obtained, as seen in Fig. 12, were sparse but sufficient (just barely) to allow estimates of the effective length of the combustion zone. [More trials were desirable, to get more data, but the X B M 2 burners were at this point on the verge of failure due to corrosion, and the project time was also exhausted.] At the lowest temperature, the combustion zone at its end extended to the combustion chamber boundaries (roof, floor, blind sidewall, and front wall). 11 |