| OCR Text |
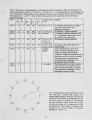
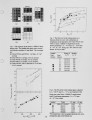
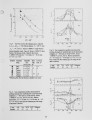
Show as on. [There is not space here to show the many other graphs like Fig. 5, and numerous related graphs, of the voluminous results obtained in the present work, but these are available in the report of Becker & Sobiesiak (1996) in which the data are also tabulated] Practically, interest is normally confined to positive levels of O2 (positive excess air). The data there are well correlated by ZNOr = 20(l + 0.42Xo'2 58)(7; /400 °C)144[m/(-A/2c)/300kW]058, (4) X0i > 0, 200 <Ta < 400 °C, and 75 < mf(-Ahc)< 375 kW, where Xm, is in ppm, X0i is in %, Ta is in °C, and m/(-A/?c)is in kW. Having the pilot burner on or off had no discernible influence on N O x but did influence the combustion stability, as discussed elsewhere herein. Data were obtained with other burner configurations (D2 = 25.87, 19.05 and 25.40 m m , and 0\ = 35° and 42.5°; see Table 4). The variation of N O x with variations in oxygen level and air preheat differed little from that expressed in (4). The effect of firing rate, however, showed substantial changes and there was also some shift in the absolute level of NO*. The shifts occurring are well conveyed by Fig. 6 which shows the N O x level at X0 = 3 % (the common O2 level for comparing emissions) and Ta = 400 °C as a function of the firing rate. To accommodate these results, (4) is written in the general form Xmx = Co(\ + 0A2X°o 5 2*)(Ta /400 °C)]M[mf(-Ahc)/300kWY. (5) The coefficient C0 is the value of the ordinate in Fig. 6 at mf(-Ahc)= 300 kW, divided by 1 -1- 0.42(3)°58 = 1.80. The values of C0 and the exponent n are summarized in Table 5. It is seen in Fig. 6 that N O x is minimal at the two smaller diameters D2, namely 15.88 m m and 19.05 mm, with 0\ = 35°. At the largest diameter, 24.31 m m , the N O x roughly doubles. The emissions at 6\ = 30° and 42.5° with D2 = 19.05 m m differ little from each other but are somewhat higher than at 6\ = 35°. Overall, there appears to be a minimum in emissions in the neighborhood D2= 16 to 19 m m and 6\ = 35°. 7.2.2. The Series 1-XBM1-T/Fsingle-burner, tunnel-chamber trials with high temperature For the XBM1 burner, the value of D2, 15.88 mm, was like those producing minimum emissions from the X B M 2 in the trials described above, and the values of D\ and 62, namely 6.22 m m and 10°, were virtually the same. The fuel port angle, however, 6\ = 65°, was much higher, and certainly at the maximum level that might ever be considered practically. Several of the trials with this burner were conducted with a tunnel combustion chamber and with the floor sink panels completely covered with blanket insulation, as in the Series 1-XBM2-T trials. At the lower air preheats, the N O x emissions were about the same as the lowest levels seen with the X B M 2 burner, but at the higher preheats they were greater, by about 30 % at preheats around 400 °C. More importantly, there was a strong luminosity in the flames at the higher preheats, indicating a significant change in the chemistry, with fairly heavy sooting. The greatest difference, however, was in the diminished combustion stability and the evident enlargement of flame size. This performance is unlikely to be considered practically interesting, so there is little point in dwelling on it here. 9 |