| OCR Text |
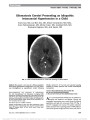
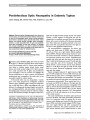
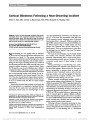
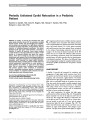
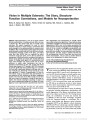
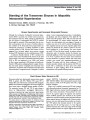
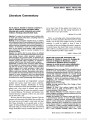
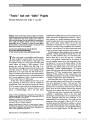
Show Role of the Macular Optical Coherence Tomography Scan in Neuro-Ophthalmology Randy H. Kardon, MD, PhD Background: Recent improvements in optical coherence tomographic (OCT) resolution and automated segmentation software have provided a means of relating visual pathway damage to structural changes in the retinal nerve fiber layer (RNFL) and corresponding soma of the ganglion cells in the inner layers of the macula and also in the outer photore-ceptor layer in the macula. Evidence Acquisition: Studies correlating retinal structure with function are reviewed in the context of OCT in optic nerve and retinal disorders. Results: Recently published work provides evidence showing a strong relationship not only between the RNFL and visual threshold in optic nerve disorders but also between visual sensitivity and the inner layers of the retina in the macula, where the cell bodies of ganglion cells reside. Acquired and genetic disorders affecting the outer retina show correlation between visual sensitivity and the thickness of the outer photoreceptors. These relationships help localize unknown causes of visual field loss through segmentation of the retinal layers using spectral domain OCT. Conclusions: Advances in relating the structure of the ganglion cell layer in the macula to the corresponding axons in the RNFL and to visual function further our ability to differentiate and localize ambiguous causes of vision loss and visual field defects in neuro-ophthalmology. Ganglion cell layer analysis in volume OCT data may provide yet another piece of the puzzle to understanding structure-function relationships and its application to diagnosis and monitoring of optic nerve diseases, while similar structure-function relationships are also being elucidated in the outer retina for photoreceptor diseases. Journal of Neuro-Ophthalmology 2011;31:353-361 doi: 10.1097/WNO.0b013e318238b9cb © 2011 by North American Neuro-Ophthalmology Society Most clinicians, especially neuro-ophthalmlogists and glaucoma specialists, have been trying to understand whether the information yielded by optical coherence tomog-raphy (OCT) is really helping them to improve upon the clinical care of their patients. Since its inception, OCT had provided new information about the status of the optic nerve, in terms of axon loss, providing information about the thickness of the retinal nerve fiber layer (RNFL). As neuro-ophthalmologists have attempted to incorporate the quantification of RNFL thickness into their decision making, they have gained new insight into both its clinical usefulness and its limitations. Recently, the use of the macular OCT has helped to further expand the usefulness of OCT in neuro-ophthalmology patients, especially as spectral domain optical coherence tomography (SD-OCT) has improved resolution and shortened the time for sampling of tissue volume. More advanced image analysis algorithms have improved the ability to segment the retinal layers in the macula, allowing improved detection and differentiation of the cause of visual loss. RNFL IN NEURO-OPHTHALMOLOGY: USEFULNESS AND LIMITATIONS In the past, the use of OCT in neuro-ophthalmlogic clinical decision making has primarily focused on the status of the RNFL thickness in relation to the threshold sensitivity of the corresponding area of visual field (1). Theoretically, it is expected that the degree of thinning of the RNFL will have a meaningful correlation with optic nerve function in a pa-tient with loss of axons (2-4) and less correlation of struc-ture with function in locations where axons are still intact but not functioning. In the latter case, either a return of function may still be possible, as in the case with some eyes with compressive optic neuropathy (5), acute optic neuritis (6-9), or ischemic optic neuropathy. Alternatively, the axons may have undergone irreversible dysfunction but not enough time has elapsed to produce atrophy and thin-ning of the RNFL (1). It has generally been accepted that acquired postgeniculate damage to the visual pathway in Section Editors: Grant T. Liu, MD Randy H. Kardon, MD, PhD Department of Ophthalmology, University of Iowa, Iowa City, Iowa; and Department of Veterans Affairs, Iowa City, Iowa. The author reports no conflicts of interest. Address correspondence to Randy H. Kardon, MD, PhD, 200 Haw-kins Drive, Pomerantz Family Pavillion, Iowa City, IA 52242; E-mail: randy-kardon@uiowa.edu Kardon: J Neuro-Ophthalmol 2011; 31: 353-361 353 State-of-the-Art Review Copyright © North American Neuro-Ophthalmology Society. Unauthorized reproduction of this article is prohibited. adults usually does not result in trans-synaptic retrograde degeneration with optic atrophy. Recently, evidence has been published, which has questioned this by showing thin-ning of the RNFL in each eye of patients with homony-mous field loss, corresponding to what would be expected if trans-synaptic degeneration had taken place (10). Such results need confirmation with detailed MRI evaluation to confirm that the acquired pathology is restricted to the postgeniculate visual pathway and does not involve the optic tract. The clinical interpretation of axon loss becomes even more difficult in the setting of optic disc edema associated with visual field loss, since there may be swelling of some axons with atrophy of neighboring axons, confounding the relationship between RNFL thickness and corresponding visual field sensitivity. This is where evaluation of the thickness of the retina in the macula or its inner layer may be helpful, since the RNFL contributes very little to macular thickness. Loss of neurons in the setting of optic disc edema would be likely to be detected in the macula, where the ganglion cell layer would become thinner over time as atrophy takes place. This situation is most common in conditions where the optic disc edema lasts more than a few weeks, such as in anterior ischemic optic neuropathy (AION), papilledema from raised intracranial pressure, orbital optic nerve sheath meningioma with associated disc edema from venous stasis retinopathy, and in some cases of compressive optic neuropathy in the orbit, as in Graves orbitopathy. Another potential confounding variable is the status of other components that make up the thickness of the RNFL, besides axons, such as blood vessels and glial elements, which may influence the measured thickness of the RNFL (1,11,12). Attempts to quantify the relationship between structure and function between RNFL thickness and visual threshold at corresponding locations have revealed that there is a correlation (primarily studied in glaucoma and AION) but not as great as one would expect (1-4). Factors such as measurement variability in both visual threshold and RNFL thickness, the influence of nonneuronal elements on the RNFL thickness, such as blood vessels and glial elements, and the interindividual variation in mapping of RNFL bun-dles to their corresponding area of the visual field confound the correlation in an individual patient. We have recently reviewed this topic (1) and have provided evidence for a lin-ear model relating visual threshold (unlogged) and RNFL thickness in glaucoma and AION (2-4). This is depicted in Figure 1 in semi-log plots. If the data in Figure 1 were replotted with both axes on a linear scale, the relationship would be a straight line. The significance of the linear re-lationship provides evidence against a critical tipping point where loss of structure precedes loss of function. Rather, the fit of data to a linear model implies they are both propor-tionate to one another across all levels of disease severity. While the relationship between RNFL thickness and visual field sensitivity appears to correspond to a linear model, there are still components of measurement variabil-ity (such as the variability between and within subjects) that impose limitations on this framework and its application to individual patients (Fig. 2). In addition, the dynamic range of both the RNFL and visual threshold sensitivity and their associated measurement variability limit meaningful rela-tionships to be explored once 10 dB of threshold loss has been exceeded or if the RNFL thickness drops below 60 mm for arcuate field loss (as shown in the flat portion of the curve in Fig. 2). In glaucoma studies, the RNFL thickness has been shown to have a very good sensitivity and specificity for diagnosing glaucoma, using receiver-operator characteristic curve analysis. It is important to keep in mind that such analyses are always influenced by the criteria that are chosen as the gold standard for the presence or absence of the disease. Such criteria include the characteristics of the population being studied, in terms of the distribution of severity of damage in the population included, and whether structure (disc appearance) or function (visual field sensi-tivity and the pattern of loss) is used as the criterion for the presence of glaucomatous or optic nerve disease. A great deal of research has also been directed toward using the RNFL thickness to detect progression of glau-comatous damage over time. Most of these studies have applied techniques that have also been used to study progression of visual field loss, namely, 1) significant change in RNFL status at a given time point from a prior baseline measurement or 2) linear regression analysis of RNFL thickness over time. The main problems encountered in detecting progression using these approaches are measure-ment variability and using population statistics to determine what constitutes a significant change over time. Individuals appear to vary considerably in the measurement variability of the RNFL, so applying population statistics (defining the variability of a given patient by applying the variability from a population of patients) to a given patient may not be optimal for individualizing the analysis of progression for a given patient. In addition, defining a statistically signif-icant change over time may not always equate with what is a clinically significant change-one that would warrant a de-viation in treatment. This is where monitoring progression by making use of the structure-function relationship has distinct advantages. True progression would be expected to result in a proportional change in both structure (RNFL thickness) and function (visual field sensitivity), based on the linear model relating the two, as described previously. Such an approach also helps to relate changes in structure to the corresponding function that could be more meaning-fully related to quality of life measures. Because the rate of visual field progression in optic neuropathies, such as glau-coma, varies considerably among treated and untreated patients and the rate is, in general, slow, the challenge in 354 Kardon: J Neuro-Ophthalmol 2011; 31: 353-361 State-of-the-Art Review Copyright © North American Neuro-Ophthalmology Society. Unauthorized reproduction of this article is prohibited. the future will be to identify as early as possible which patients are at the most risk for progression and focus ag-gressive treatment on those patients while not applying the same treatment to patients who are at low risk for significant progression over their remaining life expectancy. THE MACULAR OCT IN NEURO-OPHTHALMOLOGY: ADDED VALUE For neuro-ophthalmology, the use of the OCT for diagnosis and monitoring of optic nerve disorders pose similar problems as those for glaucomatous optic neuropathy. Further challenges are provided by disorders where optic nerve edema and associated thickening of the RNFL prevent accurate assessment of simultaneous neuronal loss (as dis-cussed in the previous section). In addition, patients with visual field loss but no associated thinning of the RNFL pose a dilemma for the neuro-ophthalmologist because outer retinal disease (e.g., acute zonal occult outer retinopathy [AZOOR]) can masquerade as vision loss from optic neuro-pathy, or in some patients with optic neuropathy, insufficient time has elapsed to cause structural loss of neurons in the RNFL or the ganglion cell layer. The following disorders put these issues into perspective and highlight how the macular OCT scan can be used to compliment the RNFL scan and the pattern of visual field loss to arrive at the correct diagnosis and monitoring of their treatment over time: 1. Multiple sclerosis/optic neuritis: In this setting, OCT-based evidence for structural loss (although nonspecific in itself) is being used to help substantiate the clinical diagnosis of multiple sclerosis in the setting of other neurologic or MRI abnormalities. More recently, it has been proposed that OCT might be used as a quantitative tool to monitor the course and treatment of demyelin-ating disease and predict which patients are likely to progress at a faster rate, requiring a more tailored treat-ment approach (6-9). There is also evidence that total macular thickness may also reflect neuronal loss in mul-tiple sclerosis (13). In the near future, probability plots relating the pattern of ganglion cell layer thinning with that of the corresponding axon bundles in the RNFL scan and relating this to the pattern of visual field loss will help to better determine areas of significant FIG. 1. Relationship of the RNFL thickness to visual field loss in patients with glaucoma and AION. A. A schematic illustrating the location of the corresponding disc sectors and field regions for the superior arcuate field (left panel) and inferior arcuate field (right panel). B. RNFL thickness as a function of field loss for the upper field/inferior disc (left panel) and the lower field/ superior disc (right panel). Data are shown for patients with AION (n = 24; filled gray circles), asymmetric glaucoma (n = 15; filled black circles), and severe glaucoma (n = 16; open circles) and for the mean of a group of 60 age-similar controls (open square). The theoretical structure-function curves are fitted to a linear function but plotted here on a semi-log plot. For the upper and lower visual field regions, 3 theoretical curves are shown (50th percentile = solid line, 95th percentile and 5th percentile = dashed lines). Reproduced with permission from Hood and Kardon (1). Kardon: J Neuro-Ophthalmol 2011; 31: 353-361 355 State-of-the-Art Review Copyright © North American Neuro-Ophthalmology Society. Unauthorized reproduction of this article is prohibited. pathologic loss of neurons. A recent review has summa-rized the available evidence relating the loss of retinal structure to the status of demyelinating disease, includ-ing evidence for the use of OCT for monitoring pro-gression of demyelinating disease (14). One of the main interest areas at present is whether acute optic neuritis represents a good model for evaluating the efficacy of new central nervous system treatment strategies for mul-tiple sclerosis, such as the use of neuroprotectants, and whether the use of OCT is a valid surrogate for modeling the status of multiple sclerosis and treatment strategy. Since thickening of the peripapillary RNFL is commonly observed by traditional OCT during the acute stage of optic neuritis, where small amount of optic disc edema can be present, the RNFL scan can be misleading when attempting to ascertain whether thinning is due to re-duction in edema or due to axon loss over time com-pared to the acute baseline state. The macular thickness or that of the ganglion cell layer complex may provide a more accurate quantification of the change in ganglion cell number and associated axons over time, relative to the baseline OCT obtained acutely, since it is relatively unaffected by acute axon swelling. In this setting, the macular OCT scan (total thickness and inner ganglion cell layer) has the potential to provide an important adjunct to the RNFL as a structural indicator of thera-peutic interventions during the acute stage aimed at pre-serving neurons. 2. Nonarteritic anterior ischemic optic neuropathy (NAION): Similar to optic neuritis, it would be desirable to use OCT to identify treatments aimed at preserving axons, such as steroids, agents that further reduce edema, neuroprotective agents, or treatments aimed at improv-ing oxygenation of the optic nerve during the ischemic state. However, similar to the problems outlined above with acute optic neuritis, the acute edema and associated thickening of the peripapillary RNFL measured with traditional OCT confound the assessment of axon loss during the first 8 weeks, when optic disc edema is still present. The thickness of the macula OCT and ganglion cell layer complex would be expected to provide a better structural indicator of axon preservation or loss com-pared to the peripapillary RNFL scan. This is because the ganglion cell-inner plexiform layer complex does not become thickened during optic disc edema, as does the peripapillary RNFL. Furthermore, relating the geo-graphic pattern of ganglion cell loss to that of the RNFL and corresponding visual field loss would provide a more powerful means of assessing clinically signifi-cant loss of structure and function than just use of either the RNFL or ganglion cell layer thickness alone. In this regard, it will be important in the future to deter-mine how long it takes for the ganglion cell complex to become thinner after irreversible damage to the RNFL, so that clinical assessment and treatment decisions can be made. 3. Differentiation between NAION and arteritic AION: A common problem faced by the neuro-ophthalmologist is whether acute visual loss associated with optic disc edema in an elderly patient is due to giant cell arteritis or NAION. Most clinical investigations focus on the presence or absence of systemic symptoms of giant cell arteritis, the presence of pallid optic nerve edema, the profoundness of the visual field loss, and the presence of acute phase reactants to inflammation in the serum. Fluorescein angiography may also be beneficial in iden-tifying outer retinal ischemia due to occlusion of one or more posterior ciliary arteries if obtained within the first 10 days of vision loss. In this setting, the macular OCT may also be useful for identifying acute loss of photore-ceptor structure, particularly whether there is disruption of the inner-outer photoreceptor segment line of in-creased intensity seen with SD-OCT (15-17). The pres-ence of OCT evidence of outer retinal layer disruption in the context of profound visual loss and optic disc edema would help point toward arteritic AION as the diagnosis differentiating it from NAION. FIG. 2. Sources of measurement variability between sub-jects (red ellipses) and within subjects (blue ellipses) and combined variability (green ellipses) in both function (visual field loss, x axis) and structure (OCT RNFL thickness, y axis). The ellipses are the 95% confidence boundaries of the linear model of structure vs function with variability component shown for different levels of glaucoma disease severity; d, expressed in decibels of field loss. Note that for OCT, the within subject repeat measurement variability is fairly constant over the entire range of disease severity, but the repeat within subject variability increases dramatically for visual field sensitivity in the mid range of severity. The interindividual variation in visual field sensitivity is fairly constant, but for OCT, it is highest between subjects that have normal visual field sensitivity. Reproduced with permission from Hood et al (4), copyright © Association for Research in Vision and Ophthalmology, 2010. 356 Kardon: J Neuro-Ophthalmol 2011; 31: 353-361 State-of-the-Art Review Copyright © North American Neuro-Ophthalmology Society. Unauthorized reproduction of this article is prohibited. 4. Compressive optic neuropathy: The presumption in compressive optic neuropathy is that the greater the number of axons that are present at the time of diag-nosis, the higher the potential for visual recovery if decompression is successful (5). Here, the confounding variables related to the interpretation of OCT in com-pressive optic neuropathy lead to the following ques-tions: 1) how much time must elapse before axonal degeneration is detectable on OCT performed at the time of diagnosis and 2) how many neurons/axons are required to support adequate visual function, which may influence treatment decisions? Since the central visual field is commonly affected in compressive optic neuropathy and treatment decisions are weighted more heavily toward the status of the central visual field and corresponding retinal ganglion cells, it would seem log-ical to monitor the thickness of the ganglion cell layer complex in the macula rather than the thickness of the maculopapillary bundle of the RNFL scan. This is be-cause the maculopapillary bundle is relatively thin in normal eyes and varies between individuals, resulting in less dynamic range from which significant axon loss can be measured. Since the ganglion cell layer is thick-est in the macula and perifoveal area, it should provide a better structural target on which to make treatment decisions related to the chance of visual recovery after decompression. 5. Papilledema: When the optic nerve appears swollen, the main questions applicable to OCT are as follows: 1) whether true papilledema is present vs pseudopapil-ledema (18), 2) whether the change in optic disc edema over time can be better quantified using thickening of the RNFL with OCT compared to the fundus appear-ance of the optic nerve, 3) whether subretinal fluid under the fovea is contributing to vision and visual field loss, and 4) whether axon loss can be detected while the disc is still swollen and differentiated from a reduction in RNFL thickness due to lowering of intracranial pres-sure. In this respect, the peripapillary RNFL measured with traditional OCT scan poses limitations on the assessment of whether disc edema is becoming less due to reduction of intracranial pressure or whether ongoing axon loss is responsible for the decrease in disc edema. The macular OCT scan and thickness of the retinal ganglion cell layer complex may add much needed clinical information in the setting of chronic papilledema undergoing treatment; if axons are indeed dying off, then the inner layers of the macula will show thinning, but if disc edema is less due to lowering of intracranial pressure and neurons are being preserved, then the inner layers of the macula should not become thinner. 6. Differentiation of optic neuropathy from retinopathy and identifying disorders in which both are present: OCT scans of other portions of the posterior pole besides the RNFL can be very revealing. For example, acute or subacute visual field loss with a thickened macula on OCT but without obvious evidence of retinal edema on fundus examination may help point the diagnosis more correctly toward a recent branch or central retinal artery occlusion and shift the diagnostic probability away from anterior or posterior ischemic optic neuropathy, inflammatory, or compressive optic neuropathy. In the chronic state, an abnormally reduced total macular thick-ness keeping company with a thinned RNFL and pale nerve may also help make the diagnosis of a previous retinal artery occlusion (causing thinning of the ganglion cell layer, inner plexiform layer, and the bipolar cell layer). In such cases, the thinning of the macula is much greater than with optic neuropathy, since the bipolar cell layer usually becomes thinned in addition to the ganglion cell layer and inner plexiform layer. Segmentation of the retinal layers within the macula would help to further differentiate a past retinal artery occlusion from an optic neuropathy without requiring a Ganzfeld or multifocal electroretinogram or neuroimaging. Another example would be a patient with possible neuroretinitis and per-sistent visual field loss; the combination of an OCT scan of the peripapillary RNFL and macular scan may help reveal the layers of the retina, which are most likely to be the source of pathology explaining the visual field loss. Neuroretinitis usually affects the RNFL, ganglion cell layer, and other layers of the retina, along with the pres-ence of highly reflective exudates seen in the outer plex-iform layer in OCT scans of the macula. Most ophthalmologists use the macular OCT to diagnose dis-orders causing pathology in the inner or outer retina, which cause 1) fluid accumulation in the retina (e.g., cystoid macular edema, diabetic macular edema, vitreal traction, perifoveal telangiectasia, or choroidal neovascu-lar membrane), 2) disruption of the outer layer (e.g., trauma, neovascular membranes, or inflammatory disor-ders), or 3) macular holes. Such patients often make their way into a neuro-ophthalmology clinic without a certain diagnosis, and a macular OCT may be an important imaging tool for narrowing the differential diagnosis and reducing the cost of an extensive workup for an unknown cause of visual loss. A common presentation might be a patient referred with a diagnosis of optic neuritis but showing an enlarged blind spot or geographic visual field loss not corresponding to a retinal nerve fiber distribution. Such patients may have AZOOR, the big blind spot syndrome, or multiple evanescent white dot syndrome and can be diagnosed with greater certainty if the outer photoreceptor layer shows a disruption of the inner-outer segment line of brightness on SD-OCT. The retinal area of disruption usually corresponds to the location of visual field loss and may be reversible in some cases (15). Other pathologies encountered by a neuro-ophthalmologist that may result in thinning of Kardon: J Neuro-Ophthalmol 2011; 31: 353-361 357 State-of-the-Art Review Copyright © North American Neuro-Ophthalmology Society. Unauthorized reproduction of this article is prohibited. the macular OCT or disruption of the photoreceptor structure include hydroxychloroquine (Plaquenil) toxicity (19) and other retinopathies disrupting the photoreceptor layer, including retinitis pigmentosa (16,17). As discussed above, there are a number of clinical situations that limit the uses of the RNFL OCT scan by itself in aiding the diagnosis of visual loss and assessing change over time. The incorporation of the macular scan acquired by SD-OCT may provide additional information to arrive at the correct diagnosis and in making treatment decisions over time. Although the average total retinal thickness of macular scans can be helpful, the spatial distribution of the thickness into sectors provides even greater information. Many of the newest report printouts from SD-OCT machines show the sector thickness and its relation to age-matched normal scans as a probability plot, similar to an automated visual field. More recently, a poste-rior pole scan has been introduced in the Spectralis OCT (Heidelberg Engineering, Heidelberg, Germany), which encompasses approximately 17° radius of retina and which relates the asymmetry between the thickness of small square areas of the superior and inferior retina and also the inter-ocular asymmetry of square areas between the right and left eyes. In addition to the spatial distribution of thickness, the qualitative assessment of its structure in different retinal layers can be very helpful, and additional quantification of the thickness of individual layers would be even more useful to localize which retinal layer is affected by a certain disorder, as shown in Figures 3-5. This has prompted an interest in imaging the source of the axons-the soma of retinal gan-glion cells, which predominate in the macula. Accurate quan-tification of the thickness of each retinal layer would not only provide much needed information on the inner retinal layers but would also provide similar information on the outer retinal layers as a built-in control to provide assurance of the location of the pathology. Here, the question is how to best take advantage of the added resolution and spatial sam-pling offered by SD-OCT so that the ganglion cell layer can be accurately quantified to reflect the number of neurons present. This also presupposes that imaging of the ganglion cell layer in the macular region provides adequate spatial sampling to reflect the status of disease affecting not only the macula but also regions peripheral to it. SEGMENTATION OF THE GANGLION CELL LAYER WITHIN THE CENTRAL MACULA WITH SD-OCT AND ITS POTENTIAL ADVANTAGES 1. The retinal ganglion cells are densest in the macula and form a stratified multicellular layer within the central 6° FIG. 3. Automated software 3-dimensional segmentation of the retinal layers of the normal macula using SD-OCT. Seg-mentation is shown for 5 successive slices of the volume macular scan (courtesy of Michael Abramoff, MD, PhD, and Mona Garvin, PhD). FIG. 4. Thickness (mean, top row) and thickness variability (standard deviation [std], bottom row) maps of 6 macular intraretinal layers from the right eye of 15 normal subjects. The micrometer thickness of the different macular layers is color coded (red = thickest, blue = thinnest) (courtesy of Michael Abramoff, MD, PhD, and Mona Garvin, PhD). 358 Kardon: J Neuro-Ophthalmol 2011; 31: 353-361 State-of-the-Art Review Copyright © North American Neuro-Ophthalmology Society. Unauthorized reproduction of this article is prohibited. of visual field. Therefore, loss of axons and the corre-sponding soma in this location is likely to cause a thin-ning of the retinal ganglion cell layer. 2. The lack of large retinal vessels in this location makes their confounding contribution to the thickness of the ganglion cell layer very minimal compared to the peri-papillary retina, where they do influence the RNFL measurement. 3. The mapping of visual field location to corresponding ganglion cell soma is less complicated than the situation with the RNFL bundles and may show less interindividual developmental variability. Simplistically, a focal light in the macula activates the ganglion cells directly underlying it. In the foveal and perifoveal location, this is not strictly the case, and some modification has to be made in this area of the visual field due to displaced ganglion cells. 4. Recent advances in OCT image analysis using both manual (15) and automated analysis in 3 dimensions (16,19) have provided a potential solution for delin-eation of the different neuronal layers in the macula (Figs. 3, 4). 5. Preliminary attempts to quantify the correlation between visual threshold and retinal ganglion cell thickness in the macula appear to subjectively correlate with the spatial pattern of visual field loss in the macula in patients with glaucoma (Fig. 5) and AION. However, a quantitative FIG. 5. Example of a glaucoma patient whose visual field defect came close to the center of their visual field and was tested with a denser visual field testing program covering only 10° radius and which corresponds to the area of retina covered by the macular scan on the corresponding SD-OCT. The gray scale map shows visual sensitivity loss that was worst in the top part of the visual field (dark areas) but also shows some loss in the inferior field. The visual field sensitivity difference from normal plot is also shown below the gray scale with the abnormal area with decrease in sensitivity sur-rounded by a red dotted line. The statistical probability plot of the same visual field data is shown in the lower left corner. Three-dimensional OCT was obtained on this eye and segmented into the inner retinal layer (ganglion cells and axons, lower left color plot) and outer retinal layer containing the photoreceptors and bipolar cells (lower right color plot). The color plots show thickness as difference from normal, so in contrast to Figure 4, red signifies a greater difference from normal or a more thinned area. Note the high spatial correlation between the thinned layer containing the ganglion cells in the in-ferior macula (thinned areas are red and yellow and depicted as difference from normal) and the corresponding superior (and inferior) areas of visual field defect. However, there is no such thinning in the outer retina, which is known to be unaffected in most glaucomatous damage. Kardon: J Neuro-Ophthalmol 2011; 31: 353-361 359 State-of-the-Art Review Copyright © North American Neuro-Ophthalmology Society. Unauthorized reproduction of this article is prohibited. correlation between ganglion cell thickness and corre-sponding overlying visual threshold has not yet been reported in detail. CHALLENGES ASSOCIATED WITH OCT ANALYSIS OF THE MACULA TO BE OVERCOME BEFORE CLINICAL MONITORING OF OPTIC NERVE FUNCTION IS USEFUL 1. Current commercially available OCT and associated software are not capable of segmenting the ganglion cell layer in 3 dimensions. At best, some manufacturers seg-ment the inner layers of the retina of the macula as a neural complex layer (RNFL, ganglion cell layer, and inner plexiform layers), but this software analysis has not yet been rigorously validated. Recently, Hood et al reported to have manually segmented 2-dimensional line scans through the macula and have shown correlation of thinning of the ganglion cell + inner plexiform layer with corresponding loss of visual threshold in glaucoma, so this approach does have promise (20). Our group has reported automated segmentation of retinal layers using a 3-dimensional graph search approach applied to vol-ume OCT scans, as shown in Figures 3-5 (21,22). 2. Outside of the central 6° of the macula, the ganglion cell layer is less of a multicellular layer. In areas where there is only a single layer of ganglion cells, it is not known if loss of soma will cause a measurable signifi-cant thinning of the cellular layer or whether it will just be replaced by glial and Mueller cells, making structural thinning of the ganglion cell layer of the inner retina difficult to measure (4). 3. Focal peripheral visual field damage would be unlikely to affect the retinal ganglion cell layer in the macula, mak-ing it theoretically less sensitive to detection and moni-toring of peripheral field pathology. However, most optic nerve diseases do show some degree of diffuse loss, and although significant abnormalities in visual thresh-old may not be detected, there still may be a measurable decrease in retinal ganglion cell thickness in the macula, even though a visual field test may appear to show mainly extramacular loss of sensitivity. 4. It is currently not known how much time it takes for a decrease in the thickness of the ganglion cell layer to occur after damage to the optic nerve at different dis-tances from the globe. The time delay between perma-nent damage and atrophy of the ganglion cell layer would provide a framework for dating the time of injury. In summary, recent improvements in OCT resolution and automated segmentation software has provided a means of relating visual pathway damage to structural changes in the RNFL and corresponding soma of the ganglion cells in the inner layers of the macula and in the outer photoreceptor layer in the macula. These advances further our ability to differentiate and localize ambiguous causes of vision loss and visual field defects in neuro-ophthalmology. Ganglion cell layer analysis in volume OCT data may provide yet another piece of the puzzle to understanding structure-function relationships and its application to diagnosis and monitoring of optic nerve diseases, while similar structure-function relationships are also being elucidated in the outer retina for photoreceptor diseases. REFERENCES 1. Hood DC, Kardon RH. A framework for comparing structural and functional measures of glaucomatous damage. Prog Retin Eye Res. 2007;26:688-710. 2. Hood DC, Anderson SC, Wall M, Kardon RH. Structure versus function in glaucoma: an application of a linear model. Invest Ophthalmol Vis Sci. 2007;48:3662-3668. 3. Hood DC, Anderson S, Rouleau J, Wenick AS, Grover LK, Behrens MM, Odel JG, Lee AG, Kardon RH. Retinal nerve fiber structure versus visual field function in patients with ischemic optic neuropathy: a test of a linear model. Ophthalmology. 2008;115:904-910. 4. Hood DC, Anderson SC, Wall M, Raza AS, Kardon RH. A test of a linear model of glaucomatous structure-function loss reveals sources of variability in retinal nerve fiber and visual field measurements. Invest Ophthalmol Vis Sci. 2009;50:4254-4266. 5. Danesh-Meyer HV, Papchenko T, Savino PJ, Law A, Evans J, Gamble GD. In vivo retinal nerve fiber layer thickness measured by optical coherence tomography predicts visual recovery after surgery for parachiasmal tumors. Invest Ophthalmol Vis Sci. 2008;49:1879-1885. 6. Costello F, Hodge W, Pan YI, Metz L, Kardon RH. Retinal nerve fiber layer and future risk of multiple sclerosis. Can J Neurol Sci. 2008;35:482-487. 7. Costello F, Hodge W, Pan Y, Eggenberger E, Coupland S, Kardon R. Tracking retinal nerve fiber layer loss after optic neuritis: a prospective study using optical coherence tomography. Mult Scler. 2008;14:893-905. 8. Frohman EM, Fujimoto JG, Frohman TC, Calabresi PA, Cutter G, Balcer LJ. Optical coherence tomography: a window into the mechanisms of multiple sclerosis. Nat Clin Pract Neurol. 2008;4:664-675. 9. Frohman EM, Costello F, Stüve O, Calabresi P, Miller DH, Hickman SJ, Sergott R, Conger A, Salter A, Krumwiede KH, Frohman TC, Balcer L, Zivadinov R. Modeling axonal degeneration within the anterior visual system: implications for demonstrating neuroprotection in multiple sclerosis. Arch Neurol. 2008;65:26-35. 10. Jindahra P, Petrie A, Plant GT. Retrograde trans-synaptic retinal ganglion cell loss identified by optical coherence tomography. Brain. 2009;132(pt 3):628-634. 11. Hood DC, Salant JA, Arthur SN, Ritch R, Liebmann JM. The location of the inferior and superior temporal blood vessels and interindividual variability of the retinal nerve fiber layer thickness. J Glaucoma. 2010;19:158-166. 12. Hood DC, Fortune B, Arthur SN, Xing D, Salant JA, Ritch R, Liebmann JM. Blood vessel contributions to retinal nerve fiber layer thickness profiles measured with optical coherence tomography. J Glaucoma. 2008;17:519-528. 13. Burkholder BM, Osborne B, Loguidice MJ, Bisker E, Frohman TC, Conger A, Ratchford JN, Warner C, Markowitz CE, Jacobs DA, Galetta SL, Cutter GR, Maguire MG, Calabresi PA, Balcer LJ, Frohman EM. Macular volume determined by optical coherence tomography as a measure of neuronal loss in multiple sclerosis. Arch Neurol. 2009;66:1366-1372. 360 Kardon: J Neuro-Ophthalmol 2011; 31: 353-361 State-of-the-Art Review Copyright © North American Neuro-Ophthalmology Society. Unauthorized reproduction of this article is prohibited. 14. Petzold A, de Boer JF, Schippling S, Vermersch P, Kardon R, Green A, Calabresi PA, Polman C. Optical coherence tomography in multiple sclerosis: a systematic review and meta-analysis. Lancet Neurol. 2010;9:921-932. 15. Hangai M, Fujimoto M, Yoshimura N. Features and function of multiple evanescent white dot syndrome. Arch Ophthalmol. 2009;127:1307-1313. 16. Wakabayashi T, Sawa M, Gomi F, Tsujikawa M. Correlation of fundus autofluorescence with photoreceptor morphology and functional changes in eyes with retinitis pigmentosa. Acta Ophthalmol. 2010;88:e177-e183. 17. Birch DG, Wen Y, Locke K, Hood DC. Rod sensitivity, cone sensitivity and photoreceptor layer thickness in retinal degenerative diseases. Invest Ophthalmol Vis Sci. 2011;52:7141-7147. 18. Johnson LN, Diehl ML, Hamm CW, Sommerville DN, Petroski GF. Differentiating optic disc edema from optic nerve head drusen on optical coherence tomography. Arch Ophthalmol. 2009;127:45-49. 19. Chen E, Brown DM, Benz MS, Fish RH, Wong TP, Kim RY, Major JC. Spectral domain optical coherence tomography as an effective screening test for hydroxychloroquine retinopathy (the "flying saucer" sign). Clin Ophthalmol. 2010;4:1151-1158. 20. Wang M, Hood DC, Cho JS, Ghadiali Q, De Moraes GV, Zhang X, Ritch R, Liebmann JM. Measurement of local retinal ganglion cell layer thickness in patients with glaucoma using frequency-domain optical coherence tomography. Arch Ophthalmol. 2009;127:875-881. 21. Haeker M, Wu X, Abramoff M, Kardon R, Sonka M. Incorporation of regional information in optimal 3-D graph search with application for intraretinal layer segmentation of optical coherence tomography images. Inf Process Med Imaging. 2007;20:607-618. 22. Garvin MK, Abramoff MD, Kardon R, Russell SR, Wu X, Sonka M. Intraretinal layer segmentation of macular optical coherence tomography images using optimal 3-D graph search. IEEE Trans Med Imaging. 2008;27:1495-1505. Kardon: J Neuro-Ophthalmol 2011; 31: 353-361 361 State-of-the-Art Review Copyright © North American Neuro-Ophthalmology Society. Unauthorized reproduction of this article is prohibited. |