OCR Text |
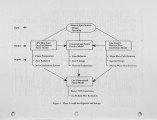
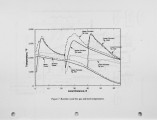
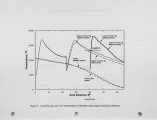
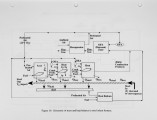
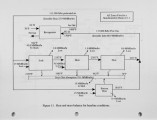
Show At the nose, the average velocity is 10 ft/s, and the average gas temperature is 2213 °F. Since the soak zone firing pattern has not changed, the increase in temperature is solely due to radiation from the top zone. The slight velocity increase is due to the increased temperature. The temperature distribution is compared to the baseline in Figure 9. Although the peak flame temperature is considerably higher by 460 °F, the peak ceiling refractory temperature increases more modestly from 2822 °F to 2950 °F (128 °F). Examination of the steel temperature profile indicates that the heat transfer rate in the top zone with oxygen enrichment is higher, since the temperature curve has a larger slope and crosses that of the baseline case. The velocity profiles are similar to the base case. Fuel efficiency, at 1.014 MMBtu/ton, has improved inversely to the production increase. Combustion is a complex phenomenon that presents great challenges for numerical modeling. S o m e of the fundamental aspects involved in combustion, such as turbulence, chemistry, radiation and soot are not even well understood today. Therefore the results presented are only approximate, consistent with the accuracy of the inputs and that of the physical models. However, experience shows that the results are helpful in predicting trends and supporting engineering design decisions. Zoned System Model The Zoned System Model provides a simple mass and energy balance calculation which may be used to evaluate the primary impacts of changes in operating conditions such as variation in gas reburn or oxygen enrichment parameters. The model divides the furnace into distinct zones. A simplified, zero dimensional radiative and convective heat transfer model is applied to each zone. Gas radiative properties are estimated based on Smith, Shen & Friedman (1982), considering the participation of C O 2 and H 2 O but not soot, consistent with the Fluent model. There is no direct heat transfer between zones except for the carryover of sensible heat as furnace gases pass from one zone to another, and through interaction with the steel which passes through each zone. Because the steel moves counter to the gas flow direction, the steel heat transfer is marched backwards from a known exit temperature to the inlet temperature, matched by adjustment of other input parameters (heat transfer constants for the initial Baseline case, and steel feed rate for conditions where furnace efficiency varies). The results of the detailed C F D model are used to refine the model. This decoupled zone approach allows for quicker evaluation of performance impacts than is possible with a full C F D simulation. Since the impact of Oxygen Enrichment based on C F D has been presented above, only Zone System Model predictions of the impacts of Gas Reburn by itself are included here. For the model of Gas Reburning applied to the top Heat Zone alone, the model furnace is divided into four zones: Soak, Bottom, and a subdivision of the top Heat Zones into an upstream and downstream part. The two Upper Heat zones are separated by a vertical plane coincident with the burner wall of the bottom zone, which is about the location where reburn fuel is to be injected in the top zone. O F A is also assumed to follow shortly after in the second top Heat Zone, so that the zone may be considered to operate at the burnout stoichiometry. Figure 10 shows a block diagram of the zones for this furnace and the interaction between them. (However, the upper heat zone and O F A zones have been combined into one section in the current model.) Gases from the bottom zone bypass the upper heat zone entirely and are mixed with the flue gases from the top before entering the recuperator. The ducts leading from the heat zones to the recuperator are not modeled separately but are implicitly included in the regenerator calculation. 8 |