OCR Text |
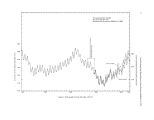
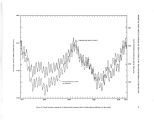
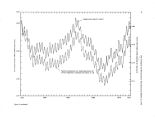
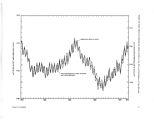
Show 22 Utah Geological and Mineral Survey Water- Resources Bulletin 21, 1976 DIKED AREA SOUTH PART S7 I-'-;"--'.. '••"•"•'• ' ' I-;; 11!* LSOL IIOT LUPPT EXPLANATION Zone of diffusion and mixing boundary between brines of different density - ( approximate altitude 4,175 feet [ 1,272 metres] above mean sea level in south part) LSDL V Dissolved- solids load in deep brine layer in south part Water surface Salt precipitation ( CLSPPTorCLNPPT) See glossary for description of symbols Salt re- solution ( ASOLN or ASOLS) Figure 11. Schematic diagram showing salt balance for proposed diking option. ground- water inflow between the 4,200- ft ( 1,280.2 m) shoreline and the position of any lower shoreline. Thus as the stream entered the lake at a shoreline lower than 4,200 ft ( 1,280.2 m), some of the surface inflow would be what was computed as ground- water inflow at a shoreline of 4,200 ft ( 1,280.2 m). The total ground- water inflow to the lake was estimated to be 75,000 acre- ft ( 92.5 hm3) per year, and monthly estimates are shown in table 8 ( T. Arnow and J. C. Stephens, written commun., Apr. 22, 1974). The total estimate is subdivided for the north and south parts of the lake, Farmington Bay, Bear River Bay, and the shoreline extending from Bear River Bay to Syracuse. The entries in table 8 represent the estimates of average ground- water inflow to Great Salt Lake during 1931- 73. Any error in these estimates would be incorporated with the calibration factor ( Ium) discussed in a later section. Calibration of the Model After compilation of the inflow estimates for 1931- 73, the data were tested in the model of the water budget discussed earlier in this report. The monthly lake altitudes were computed by the model for the 1931- 73 base period and then compared with observed lake altitudes. The observed and computed lake altitudes for the first computation by the model indicated that the net inflow estimate ( or volume change, AS) was too low during the early part of the base period and too high during the latter part. This is indicated by the skewed contrast between the observed and computed lake altitudes in figure 9. The skewed contrast was removed in a second computation when the annual evaporation was assumed to be constant instead of variable from 1931 to 1973. Although the lake altitude computed with this assumption falls below that of the observed lake altitude, the relation is consistent throughout the base period. The annual evaporation correction factors, which were based on data of one station ( as discussed previously), were probably a result of sampling error and are not indicative of actual trends of evaporation rates. However, there were 3 years in which the evaporation rates had to be adjusted to prevent a large divergence between the observed and computed lake altitudes. During 1937, 1939, and 1970, the annual evaporation was corrected by the factors of 0.9, 0.8, and 1.15, respectively. Comparison of the computed ( second model computation) and observed hydrographs indicates a deficiency in the estimated net inflows, as computed |