| OCR Text |
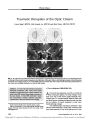
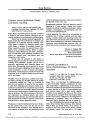
Show ORIGINAL CONTRIBUTION Degeneration of Retinal Ganglion Cells After Optic Nerve Sheath Fenestration in an Experimental Rat Model Nils- Claudius Gellrich, MD, DDS, Constantin Stuehmer, DDS, Kai- Hendrik Bormann, DDS, Isabella Mu ¨ cke, MD, Alexander Schramm, MD, DDS, Ulf Theodor Eysel, MD, and Martin Ru ¨ cker, MD, DDS Background: Optic nerve sheath fenestration ( ONSF) is a surgical procedure that is sometimes performed in patients with optic disc edema from increased intracranial pressure. The objective of this study was to assess the consequence of ONSF on optic nerve axons, retinal ganglion cells ( RGCs), and retinal amacrine cells. Methods: The optic nerves of 22 male Wistar rats were assigned to one of three groups. In Group 1 ( n = 12), the rats underwent unilateral ONSF. In Group 2 ( n = 10), the rat optic nerves were unilaterally exposed but were not operated on. Group 3 ( n = 22) consisted of the optic nerves of Group 1 and Group 2 rats that were neither operated on nor exposed. Thirty days later, a cresyl violet staining method was used to assess the number and sizes of RGCs and amacrine cells. Optic nerve axons were assessed by means of glial fibrillary acidic protein ( GFAP) immunoreactivity. Results: ONSF was associated with a significant reduction ( P < 0.05) in the number and size of RGCs and amacrine cells. Optic nerve axons were un-disturbed. Conclusions: Although ONSF does not apparently injure the optic nerve axons, loss and shrinkage of RGCs is a caution when considering ONSF as a treatment. ( J Neuro- Ophthalmol 2009; 29: 275- 280) T he arachnoid and subarachnoid spaces around the optic nerve communicate freely with the intracranial subarachnoid space via the optic canal. For this reason, elevated cerebrospinal fluid ( CSF) pressure can be trans-mitted to the optic nerve. The induced papilledema can result in visual loss. Intraorbital optic nerve sheath fenes-tration ( ONSF) is a procedure that is often performed as an alternative to CSF shunting to relieve CSF pressure around the optic nerve in patients with idiopathic intracranial hypertension ( IIH) ( 1- 4). The benefit of ONSF, however, remains controversial due in part to variations in clinical outcome and in part to the poor understanding of its underlying mechanisms ( 6- 8). The purpose of this study was to quantitatively assess the effect of ONSF on retinal ganglion cells ( RGCs) and optic nerve axons in a rat model. METHODS Animals All animal procedures were approved by the respon-sible ethics committee and were conducted in accordance with the German Protection of Animals Act and the National Institutes of Health Guide for the Care and Use of Laboratory Animals ( NIH Publication No. 85- 23, revised 1985). The study involved 22 male Wistar rats ( Charles River, Sulzfeld, Germany) weighing 300- 350 g. The animals were housed singly in cages. They were given access to tap water and a commercial pellet diet ad libitum ( Altromin, Lage/ Westphalia, Germany). Randomization In a randomized fashion, one orbit was surgically accessed in each animal. In 12 male Wistar rats, an optic nerve sheath fenestration procedure was performed using a 2- mm longitudinal incision ( Group 1). In an additional 10 male animals, the optic nerves were exposed on one side but were not operated on ( sham surgery) ( Group 2). The 22 optic nerves that were neither operated on nor exposed served as controls ( Group 3). After a survival period of Department of Oral and Maxillofacial Surgery ( N- CG, CS, K- HB, AS, MR), Hannover Medical School, Hannover, Germany; Department of Ophthalmology and Orthoptics ( IM), University of Saarland, Homburg, Germany; and Institute of Neurophysiology ( UTE), Ruhr University Bochum, Bochum, Germany. Address correspondence to Martin Ru ¨ cker, MD, DMD, Department of Oral and Maxillofacial Surgery, Hannover Medical School, 30623 Hannover, Germany; E- mail: ruecker. martin@ mh- hannover. de J Neuro- Ophthalmol, Vol. 29, No. 4, 2009 275 30 days, the animals were anesthetized again, and the eyes and intraorbital optic nerves were assessed histologically. Surgical Preparation The rats were anesthetized with chloral hydrate ( 400 mg/ kg body weight intraperitoneally), and their heads were fixed in a stereotaxic frame. A median frontal incision was made to expose the superior orbital rim. The superior orbital vein was identified and preserved. The retrobulbar space was accessed, and a large portion of the Harderian gland was removed, allowing the surgeon access to the eye muscle cone. Once the eye was gently pulled forward, the ocular muscles over the optic nerve were detached and held apart with a blunt hook so that only the retractor bulbi muscle remained close to the optic nerve. Care was taken to maintain retinal perfusion during this maneuver. The retractor bulbi muscle was then cut 2 mm behind the posterior portion of the eye and separated from the optic nerve. In Group 1 animals, ONSF was performed using mag-nifying lenses and microsurgical instruments, in particular, a 23- gauge MVR blade. Two millimeters proximally to the optic nerve head, a rectangular window of dura and arachnoid measuring 2 mm in length and 1 mm in width was excised from the bulbous portion of the optic nerve with preservation of the pia mater. Throughout the pro-cedure retinal perfusion was maintained as monitored by ophthalmoscopy. There was no bleeding in the immediate vicinity of the optic nerve. The swinging flashlight test was used to detect relative afferent pupillary defects before surgery, immediately after surgery, and before paraformal-dehyde perfusion ( 30 days after surgery). Histologic Preparation Unless otherwise stated, all chemicals were obtained from Sigma ( Deisenhofen, Germany) and were of the highest commercially available purity. After in vivo perfusion with heparinized Ringer's lactate solution ( 0.2% Liquemin), the rats were perfused with a fixative containing 4% paraformaldehyde. The perfusion- fixed eyes and intraorbital optic nerves were removed and further fixed in a solution containing 2% paraformaldehyde and 2% glutaraldehyde in 0.1Msodium cacodylate buffer at pH 7.4 for 24 hours at 4 C. After having been extensively rinsed in buffer, the retinas were explanted, whole- mounted onto gelatin- coated slides, and stained using the cresyl violet method to label RGCs. The optic nerves were post- fixed in 2% osmium tetroxide and 0.1 M sodium cacodylate buffer for 2 hours at 4 C. They were then dehydrated and embedded in epoxy resin ( Araldite) using a standard protocol. To rule out procedure- related optic nerve damage, semi- thin sections were stained for myelin and glial fibrillary acidic protein ( GFAP). They were stained for myelin with 1% paraphenylenediamine ( PPD) solution in methanol/ isopropanol. Unchelated stain was cleared with ethanol. Staining for GFAP involved incubating the semi-thin sections with 0.5% H2O2 in phosphate- buffered saline ( PBS) for 15 minutes and with 10% fetal calf serum ( FCS) for 30 minutes at 20C to block endogenous peroxidase activity and nonspecific protein binding. The specimens were then incubated overnight at 4C with a primary rabbit anti- GFAP antibody ( 1: 80; Sigma) followed by a secondary goat anti- rabbit antibody. Avidin- biotin- horseradish perox-idase complex was added for 1 hour at 20C. The sections were then exposed to 3,3- diaminobenzidine ( 0.05 mg/ ml) in PBS containing 1% H2O2 for 5 minutes. Between each step, the sections were washed 3 times in PBS. All incubations were performed in a humidified chamber. The slides were either left unstained or counterstained with hematoxylin. Negative controls were subjected to the same procedure without exposure to the primary antibody. All control stainings were negative. Histologic Analysis For quantitative analysis, each retina was divided into upper, upper lateral, lower lateral, lower, and medial sections. Three regions of interest ( ROIs) ( 12,346 mm 2 ) were defined in each section to accommodate possible differences in the neuronal response resulting from different axonal distances between the neuronal cell body and the site of axon damage. The central ROI was located 1.2 mm, the intermediate ROI 2.4 mm, and the peripheral ROI 2.6 mm from the optic disc. The numbers and sizes of neurons in the RGC layers were determined by evaluating each ROI at a magnification of 900 times using a camera lucida, a digitizer tablet attached to a personal computer, and Bioquant System IV software ( R& M Biometrics Inc., Nashville, TN). For each retina, the total number of neurons ( N) was calculated according to the following formula: N ¼ NX 3ðAR 30: 8556Þ3ROI 1 where NX is the mean number of neurons ( averaged over the three ROIs), AR is the size of the retina ( in mm 2 ), ROI is an area of 0.012346 mm 2 , and 0.8556 represents a factor that was calculated to represent the portion of the RGC layer in Wistar rats that is covered by neurons and is not occupied by large intraretinal vessels ( 9). A total of 50% of the neurons in the RGC layer were classified as RGCs, which project their axons centrally through the optic nerve. The other 50% of the neurons were amacrine cells, which do not send axons into the optic tract and are thus unaffected by optic nerve trauma ( 9). Neurons larger than 80 mm 2 in size are likely to represent RGCs, whereas neurons smaller than 80 mm 2 are likely to represent amacrine cells. 276 q 2009 North American Neuro- Ophthalmology Society J Neuro- Ophthalmol, Vol. 29, No. 4, 2009 Gellrich et al Cell counts obtained from all experimental groups were pooled, and the neurons were divided into several size classes at increments of 10 mm 2 to evaluate neurodegen-erative changes in the RGC layer ( Fig. 2). For a morphological evaluation of the optic nerves, cross sections were prepared and stained for myelin with PPD. Because GFAP, an intermediate filament protein, is expressed by glial cells in response to injury, immunore-activity to GFAP was qualitatively assessed. For measuring the cross- sectional area of the myelinated portion of the optic nerve, only nerves that conformed to the criterion of a perfect right- angular cross section were evaluated. At FIG. 1. Light microscopic images of retinal ganglion cell ( RGC) layers ( A- B) and optic nerve cross sections ( C- F) after optic nerve sheath fenestration ( ONSF) ( A, C, E) or sham surgery ( B, D, F). Cresyl violet- stained RGCs were quantitatively assessed ( A- B). Myelin staining ( C- D) and glial fibrillary acidic protein immunohistochemistry ( E- F) revealed that there was no optic nerve degeneration after either ONSF or sham surgery. ( Bar = 100 mm.) 277 Experimental Optic Nerve Sheath Fenestration J Neuro- Ophthalmol, Vol. 29, No. 4, 2009 a magnification of 900, the numbers of myelinated axons were counted in at least 10 30 3 30- mm ROIs at random in all areas using Bioquant System IV software. The total numbers of myelinated axons were then calculated for each optic nerve cross section. Statistical Analysis Results are expressed as mean 6 SEM. Depending on the distribution of data, differences between groups were analyzed using a one- way analysis of variance ( ANOVA) or a one- way ANOVA on ranks. The parametric Student's t test or the nonparametric Mann- Whitney U test was used post hoc to isolate specific differences. P < 0.05 was considered significant. RESULTS Pupillomotor Function Compared with the controls, no animal that un-derwent sham surgery or standardized intraorbital ONSF exhibited a relative afferent pupillary defect when a swing-ing flashlight test was performed before the operation, immediately after the operation, or before paraformalde-hyde perfusion ( 30 days after surgery). Histologic Retinal Findings Figure 1 shows typical light microscopic images of cresyl violet- stained RGC layers that were obtained 30 days after ONSF or the sham operation. A computer-assisted quantitative analysis revealed that the total number of amacrine cells and RGCs in the RGC layer was signifi-cantly reduced by 7% after ONSF than after the sham operation ( P < 0.05) ( Table 1). In particular, 30 days after the interventions, the numbers of neurons larger than 80 mm 2 and smaller than 80 mm 2 were found to be signifi-cantly lower after ONSF than after sham surgery ( P < 0.05). In contrast, there was no significant difference in the numbers of glial cells in the RGC layer between Group 1 ( 10,723 6 1,053) and Group 2 ( 11,380 6 2,360). A morphometric analysis showed that the RGCs were significantly ( P < 0.05) smaller in Group 1 than in Groups 2 and 3 ( Table 1). The frequency distribution of neuronal sizes revealed a pronounced left- skewed histogram after ONSF, whereas the distribution was more homogenous in the control and sham operation groups, as indicated by the distinct frequency of neurons larger than 80 mm 2 ( Fig. 2). However, ONSF did not substantially affect the distribution of RGCs and amacrine cells. In all study groups, the density of neurons decreased from central to peripheral retina, whereas the size of retinal neurons increased ( Table 1, Fig. 2). TABLE 1. Numbers and sizes of retinal ganglion cells and amacrine cells and the numbers of axons in the corresponding optic nerves of Wistar rats after optic nerve sheath fenestration ( Group 1), sham surgery ( Group 2), and no intervention ( controls, Group 3) Group Retina Optic Nerve: Total RGCs and Amacrine Cell Numbers RGCs and Amacrine Cells per Retinal Area (% of ntotal) Total Proportion of RGCs and Amacrine Cells > 80 mm 2 (%) Total RGCs and Amacrine Cells Central Retina Intermediate Retina Peripheral Retina Total Central Retina Intermediate Retina Peripheral Retina RGCs and Amacrine Cell Size ( mm 2 ) Group 1 ( n = 12) 205,367 6,898* 38.4 ( 48.3) 34.0 ( 47.5) 27.6 ( 51.5) 85.46 0.48* 83.24 0.7* 84.54* 0.81 89.66 11.01* 110,456 6,744 Group 2 ( n = 10) 220,866 5,877 41.6 ( 53.1) 34.1 ( 55.0) 24.7 ( 55.3) 98.27 0.59 93.8 0.81 97.66 0.98 106.56 1.41 106,832 7,264 Group 3 ( n = 22) 230,236 3,711 40.8 ( 54.4) 33.5 ( 54.0) 25.7 ( 56.9) 99.41 0.4 95.61 0.56 98.19 0.68 107.03 0.91 113,587 8,811 RGCs and amacrine cells per area ( 12,346 mm 2 ) in the central, intermediate, and peripheral regions of the retina are given in absolute numbers and as a percentage of the total RGCs and amacrine cells count ( for the entire retina). RGC and amacrine cell size is given in mm 2 . Results are expressed as mean 6 SEM. RGC, retinal ganglion cell. * P < 0.05 versus groups 2 and 3. 278 q 2009 North American Neuro- Ophthalmology Society J Neuro- Ophthalmol, Vol. 29, No. 4, 2009 Gellrich et al Histologic Optic Nerve Findings Figure 1 shows optic nerve cross sections stained with PPD. Intensely stained myelin appeared as dark rings surrounding unstained cores ( the axons themselves). A qualitative analysis showed that these fibers were clustered in fascicles, which were separated by lightly stained bands of connective tissue. Immunohistochemical staining re-vealed that GFAP was localized on glial intermediate fila-ment bundles. There were no differences between groups 1 and 2 ( Fig. 1). In addition, the axon count was comparable in all groups assessed ( Table 1). After ONSF or sham sur-gery, the optic nerves exhibited a normal histomorphology. FIG. 2 Frequency distribution of neuron sizes at increments of 10 mm2 in retinal ganglion cell ( RGC) layers after optic nerve sheath fenestration ( ONSF) ( A; counts = 9 530, n = 12) and after sham surgery ( B; counts = 8 622, n = 10). The RGC layers of unoperated and unexposed optic nerves ( C; counts = 19 221, n = 22) served as controls. The lower portion of a bar represents the central region, the middle portion the intermediate region, and the upper portion the peripheral region of the retina. Note that the frequency distribution reveals a pronounced left- skewed histogram after ONSF. 279 Experimental Optic Nerve Sheath Fenestration J Neuro- Ophthalmol, Vol. 29, No. 4, 2009 Direct surgical damage to the optic nerve by ONSF was therefore ruled out. DISCUSSION This study reveals that ONSF caused atrophy and degeneration of RGCs and amacrine cells. The optic nerve itself appeared undamaged. The significantly reduced total number of RGCs and amacrine cells in the absence of axonal loss cannot be ex-plained solely by a degeneration of amacrine cells. Because amacrine cells are smaller than 80 mm 2 , the degeneration of these smaller neurons would result in a right- skewed histogram for the frequency distribution of neuron sizes. Taking into account the observed left- skewed histogram, our results suggest that the ONSF procedure resulted in a distinct loss of amacrine cells and a marked shrinkage of larger RGCs. In a recent report using retrograde labeling ( 17), cell body shrinkage was shown to be the initial phase of RGC degeneration. Exposure of the intraorbital optic nerve requires the eye to be carefully rotated to the side. RCG neurodegen-eration, however, is unlikely to result from the pressure that was applied to the orbital content during the procedure. Repeated ophthalmoscopy revealed no disturbances of retinal perfusion during the period of surgical preparation. In addition, RGC neurodegeneration was not observed in those animals that underwent exposure of the intraorbital optic nerve. It is therefore likely that the incision into the leptomeningeal sheath of the optic nerve induced microvas-cular changes in the optic nerve that resulted in temporary retinal hypoperfusion, which could explain the degeneration of RGCs observed 30 days after the fenestration procedure. Choroidal infarction has been reported as a complication of ONSF ( 18). Because ONSF was found to cause significant atrophy and degeneration of RGCs, the risks and benefits of ONSF should be taken carefully into account. Acknowledgments We gratefully acknowledge the excellent technical assistance provided by Ute Neubacher. REFERENCES 1. Gellrich NC. Controversies and current status in therapy of optic nerve damage in craniofacial traumatology and surgery. Mund Kiefer Gesichtschir 1999; 3: 176- 94. 2. Mauriello JA, DeLuca J, Krieger A, et al. Management of traumatic optic neuropathy- a study of 23 patients. Br J Ophthalmol 1992; 76: 349- 52. 3. Orcutt JC. Eyelid, orbital and optic nerve surgery. Curr Opin Ophthalmol 1992; 3: 670- 7. 4. Chandrasekaran S, McCluskey P, Minassian D, et al. Visual out-comes for optic nerve sheath fenestration in pseudotumour cerebri and related conditions. Clin Experiment Ophthalmol 2006; 34: 661- 5. 5. Curry WT Jr, Butler WE, Barker FG 2nd. Rapidly rising incidence of cerebrospinal fluid shunting procedures for idiopathic intracranial hypertension in the United States, 1988- 2002. Neurosurgery 2005; 57: 97- 108. 6. Miller NR. The management of traumatic optic neuropathy. Arch Ophthalmol 1990; 108: 1086- 7. 7. Sofferman RA. Transnasal approach to optic nerve decompression. Oper Tech Otolaryngol Head Neck Surg 1991; 2: 150- 6. 8. Binder DK, Horton JC, Lawton MT, et al. Idiopathic intracranial hypertension. Neurosurgery 2004; 54: 538- 51. 9. Gellrich NC, Schimming R, Zerfowski M, et al. Quantification of histological changes after calibrated crush of the intraorbital optic nerve in rats. Br J Ophthalmol 2002; 86: 233- 7. 10. Behrens von Rautenfeld D, Kaiser HE, Foeldi M, et al. The leptomeningeal resorption of cerebrospinal fluid. Lymphology 1994; 27( Suppl): 685- 7. 11. Mathog RH. Decompression of the optic nerve using a transethmoidal approach. In: Mathog RH, ed. Atlas of Craniofacial Trauma. Philadelphia: WB Saunders; 1992; 403- 7. 12. Sadun AA. The efficacy of optic nerve sheath decompression for anterior ischemic optic neuropathy and other optic neuropathies. Am J Ophthalmol 1993; 115: 384- 9. 13. Sadun AA, Win PH, Ross- Cisneros FN, et al. Leber's hereditary optic neuropathy differentially affects smaller axons in the optic nerve. Trans Am Ophthalmol Soc 2000; 98: 223- 35. 14. Villain M, Sandillon F, Muller A, et al. Macroglial alterations after isolated optic nerve sheath fenestration in rabbit. Invest Ophthalmol Vis Sci 2002; 43: 120- 8. 15. Blechingberg J, Holm IE, Nielsen KB, et al. Identification and characterization of GFAP, a novel glial fibrillary acidic protein isoform. Glia 2007; 55: 497- 507. 16. Harris SJ, Wilce P, Bedi KS. Exposure of rats to a high but not low dose of ethanol during early postnatal life increases the rate of loss of optic nerve axons and decreases the rate of myelination. J Anat 2000; 197: 477- 85. 17. Buckingham BP, Inman DM, Lambert W, et al. Progressive ganglion cell degeneration precedes neuronal loss in a mouse model of glaucoma. J Neurosci 2008; 28: 2735- 44. 18. Plotnik JL, Kosmorsky GS. Operative complications of optic nerve sheath decompression. Ophthalmology 1993; 100: 683- 90. 19. Joos KM, Mawn LA, Shen JH, et al. Chronic and acute analysis of optic nerve sheath fenestration with the free electron laser in monkeys. Laser Surg Med 2003; 32: 32- 41. 280 q 2009 North American Neuro- Ophthalmology Society J Neuro- Ophthalmol, Vol. 29, No. 4, 2009 Gellrich et al |