| OCR Text |
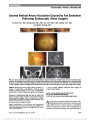
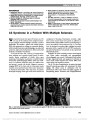
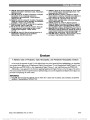
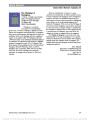
Show Correlation of Inner Retinal Thickness Evaluated by Spectral-Domain Optical Coherence Tomography and Contrast Sensitivity in Parkinson disease Christopher R. Adam, BA, Eric Shrier, DO, Yin Ding, MS, Sofya Glazman, MD, Ivan Bodis-Wollner, MD, DSc Background: To compare inner retinal layer (IRL) thickness measured by spectral-domain optical coherence tomogra-phy (SD-OCT) and contrast sensitivity (CS) in patients with Parkinson disease (PD) and in healthy control (HC) subjects. Methods: Consecutive patients with and without PD were prospectively analyzed using SD-OCT and Pelli-Robson CS testing. SD-OCT IRL (ganglion-cell complex) thickness, consisting of the nerve fiber layer, ganglion cell layer, and inner plexiform layer, was segmented using an RTVue Model-RT100 with an EMM5 scan parameter covering a 5.0 · 5.0 mm cube centered on the fovea. Thickness voxel measurements at 0.25-mm intervals at sequential radial distances from the foveola were acquired horizontally and vertically. SD-OCT thickness raw data files were imported and analyzed within MATLAB (version 7.10.0). A database of CS scores and IRL thickness values by foveal location was constructed and statistically evaluated using JMP 10 (SAS Institute, Inc, Cary, NC). Results: The results were compared between 28 eyes of 14 patients with PD and 28 eyes of 14 HC subjects. Controlling for age, mean CS scores of monocular right and randomized eyes were statistically lower in PD eyes (P , 0.05). IRL was significantly thinner in PD eyes than in HC eyes at several distances from the foveola (P , 0.05). The most numerous and significant thickness differences by diagnosis were located in the superior quadrant at a distance of 1.00- 1.75 mm from the foveal center (17 mm; P , 0.01, maxi-mum significant thickness difference and P value). Correla-tion was demonstrated between monocular CS and IRL thickness by diagnosis at multiple foveal locations for HC eyes as follows: nasal quadrant, 0.75-1.00 mm (P , 0.02); temporal quadrant, 0.50-1.00 mm (P , 0.05); superior quadrant, 1.00 mm (P , 0.05); and inferior quadrant, 1.00 mm (P , 0.03). No significant correlation was found between monocular CS and IRL thickness within PD sub-jects (P . 0.05 for each foveal location measured). Conclusion: CS and foveal IRL thickness are decreased in patients with PD. CS and IRL thickness correlated in HC subjects; however, no such correlation was demonstrated in PD. The functional deficit of dopaminergic interneurons, including amacrine cells, may outstrip the anatomic struc-tural changes in the inner retina of PD patients. Inner retinal atrophic changes may underlie the pathogenesis of CS deficit and IRL thinning in PD. Journal of Neuro-Ophthalmology 2013;33:137-142 doi: 10.1097/WNO.0b013e31828c4e1a © 2013 by North American Neuro-Ophthalmology Society First described as "shaking palsy" in 1817 (1), Parkinson disease (PD) affects more than 1 million people in the United States, has a peak incidence in the 5th to 6th decade of life, and occurs in approximately 1% of the elderly pop-ulation (2,3). PD is a progressive neurodegenerative disease traditionally characterized by the presence of specific motor symptoms such as bradykinesia, resting tremor, cogwheel rigidity, postural instability, and altered gate. The histo-pathologic hallmark of PD is the presence of Lewy bodies composed of high concentrations of intranuclear alpha-synuclein and the progressive loss of dopaminergic cells and associated transmission pathways predominantly within the striatum and substantia nigra pars compacta. There are reports of nonmotor symptoms of PD, including sensory impairment, depression, anxiety, sleep disorders, and cog-nitive disabilities (4). Ophthalmic deficits include decreased visual acuity (5), contrast sensitivity (CS) (6), visual evoked potential latency (7), abnormal electroretinographic pat-terns (8), hallucinations, and altered color perception (9). Spectral-domain optical coherence tomography (SD-OCT) has demonstrated inner retinal thinning in PD (10) and Departments of Ophthalmology (ES) and Neurology (SG, IV-B), College of Medicine (CRA), SUNY-Downstate Medical Center, Brooklyn, New York; SUNY Eye Institute (ES, IV-B), Brooklyn, New York; and Department of Electrical Engineering (YD), Polytechnic Institute of NYU, Brooklyn, New York. Supported by the Michael J. Fox Foundation. The authors report no financial or conflicts of interest. Address correspondence to Christopher R. Adam, BA, College of Medicine, SUNY-Downstate Medical Center, 450 Clarkson Avenue, Box 1213, Brooklyn, NY 11203; E-mail: christopher.adam@ downstate.edu Adam et al: J Neuro-Ophthalmol 2013; 33: 137-142 137 Original Contribution Copyright © North American Neuro-Ophthalmology Society. Unauthorized reproduction of this article is prohibited. other neurodegenerative disorders such as Alzheimer disease (11) and multiple sclerosis (12). For purposes of this study, the inner retinal layer (IRL) is defined as internal limiting membrane, nerve fiber layer, ganglion cell layer, and inner plexiform layer down to the inner nuclear layer interface (Fig. 1). Retinal dopaminergic amacrine cells are known to be localized in the IRL, while their rich interconnections are in the inner plexiform layer (13,14). Previous investiga-tions indicate that overall retinal dopamine and associated metabolites are decreased in patients with PD (14-16). Additional lines of evidence demonstrate that retinal dopa-mine deficiency may play a central role in the pathogenesis of visual dysfunction in PD (17). In part, visual impairment is thought to occur through progressive loss of dopaminergic control over horizontal cell lateral coupling and photorecep-tor coupling, influencing receptive field properties and dopaminergic modulation of various other retinal neurons (17,18). Numerous investigations have also documented reduced CS and retinal neuronal abnormalities in PD, which has been postulated to occur from decreased retinal dopaminergic activity (19,20). Although IRL thinning has been reported with SD-OCT (10), it is unclear which specific retinal layers or topographic locations are most affected in PD, or the functional signifi-cance of this neural tissue loss on the visual system. We hypothesize that decreased IRL thickness may underlie decreased CS in patients with PD and may be clinically quantifiable with SD-OCT. The purpose of the present study was to prospectively evaluate the IRL thickness and CS in PD compared to healthy control (HC) subjects. METHODS Patients This study was performed according to the principles outlined in the Declaration of Helsinki and was approved by the Institutional Review Board of the State University of New York at Downstate. All subjects underwent complete neurologic and ophthalmic examination including best-corrected Snellen visual acuity, visual field using Hum-phrey 750 Visual Field Analyzer (Carl ZeissMeditec, Dublin, CA), intraocular pressure, and dilated ophthalmoscopy. All patients with PD met the UK Brain Bank Criteria for the diagnosis of PD and were clinically stable on current medical therapy. The patients with PD were a cohort that has previously been described (10), under the care of the Parkin-son Disease and Related Disorders Center of the Department of Neurology, SUNY Downstate, and have been normalized with respect to disease severity and treatment. The HC con-sisted of family members/spouses of the patients with PD, community volunteers, and staff members with no prior ocu-lar disease other than non-visually significant cataract or mild refractive error and with no prior ocular surgery. To prevent the confounding effect of age and improve the accuracy of data analysis, age-frequency matching (minimum, 50 years and maximum, 75 years) was implemented as a component of our inclusion criteria. Contrast Sensitivity CS was measured with the Pelli-Robson CS chart (PR). The PR chart has been utilized successfully in past studies to evaluate CS deficit in PD; it provides accurate, reproducible results and was found to be easily administered and tolerated by patients with PD. The PR chart provides optotypes of 20/120 Snellen-equivalent letters of consistent size, corresponding to a spatial frequency of 4 cycles per degree, estimated as the peak of human foveal CS (21) and shown to be most affected in PD (20). The PR chart con-tains equal 0.15 log contrast steps between consecutive 3-letter groups, with 2 triplets per line, and contrast decreas-ing from near 100% to ,1%. Testing distance for CS is defined at 1 m. An illumination of 85 cd/m2 is recommen-ded for accurate results. Each subject's right eye, left eye, and binocular CS was evaluated and recorded on the accom-panying PR CS score sheet. The traditional scoring system adhered to throughout this study provides 0.15 credit per triplet if at least 2 of 3 letters within that triplet are con-firmed. Scores can range from 0 to 2.25 corresponding to log CS. Optical Coherence Tomography SD-OCT was performed using an RTVue model RT100 (Optovue, Inc, Freemont, CA). This model uses a scan beam wavelength of 840 ± 10 nm, with a sampling fre-quency of 26,000 A-scans per second and scan depth of 2.0 to 2.3 mm. Depth and transverse resolution of 5.0 and 8.0 mm, respectively, has been reported. The EMM5 scan parameter was selected for the evaluation of IRL (gan-glion- cell complex) thickness and covers a 5.0 · 5.0 mm cube centered on the foveal retina. Scans were performed on each eye for all eligible PD and HC subjects. Only scans of at least 80.0/100.0 were included. Any scan with inade-quate fixation was manually re-centered and reevaluated in MATLAB 7.10.0 (MathWorks, Inc, Natick, MA) for FIG. 1. Spectral-domain optical coherence tomography protocol for inner retinal layer (IRL) thickness; IRL measured by automated computer segmentation as defined by white boundary; IRL consisting of the internal limiting membrane, retinal nerve fiber layer (RNFL), ganglion cell layer (GCL), and inner plexiform layer (IPL) down to the inner nuclear layer interface (arrow) are indicated. 138 Adam et al: J Neuro-Ophthalmol 2013; 33: 137-142 Original Contribution Copyright © North American Neuro-Ophthalmology Society. Unauthorized reproduction of this article is prohibited. greater accuracy and optimal comparison of thickness differ-ences among the groups. For purposes of this study, the foveola was designated as location 0.0 mm with IRL thick-ness voxel data analyzed at sequential equidistant locations in all 4 macular quadrants (nasal, temporal, superior, infe-rior) at 0.25-mm intervals out to a distance of 2.00 mm from the foveal center (22). Data Analysis Our study design allowed the direct comparison of patients with PD against age-frequency matched HC subjects, providing an initial method of controlling for age, a poten-tial confounding variable. Analyzing and comparing the results of patients by segregating one eye (left eye, right eye, random) and not including both eyes of each subject within a statistical model prevented pseudoreplication of data. RTVue OCT Browser was used to export unprocessed raw IRL thickness data into a MATLAB environment for analysis. MATLAB provided the ability to match PD and HC IRL thickness values to a digitally reconstructed and color-coded mathematically defined model of the fovea, which was developed by our research team to ensure accuracy and positioning of the scan data. A database of monocular and binocular CS scores and IRL voxel thickness values by foveal location was constructed in Microsoft Excel 2007 (Microsoft, Corp, Redmond, WA). All data were statistically evaluated using JMP 10 (SAS Institute, Inc, Cary, NC). Initial data analysis consisted of comparing the mean age among groups through a 2-tailed t test (Table 1). The relationship of CS scores by diagnosis (PD vs HC) was first analyzed through an analysis of variance (ANOVA). AN-OVA testing was performed on the monocular (left, right, random) and binocular CS scores of all subjects. After ana-lyzing the ANOVA results, an additional model was con-structed to further control for age by performing an analysis of covariance (ANCOVA) designating age as a linear cova-riate. The relationship between mean randomized IRL thick-ness difference by diagnosis as measured by SD-OCT was performed through an ANCOVA analysis designating age as a linear covariate. The final data analysis consisted of performing a bivariate analysis by diagnosis of randomized monocular CS by randomized IRL thickness. To perform the random eye analyses, randomization of each subject's CS and IRL thickness data was obtained through commercially available "true" random number gen-erator software. Each subject including their right eye and left eye with corresponding CS scores and IRL thicknesses were randomly assigned a value of 0 or 1. After running the randomization program with equal allocation only one eye of each subject, either left or right, was randomized to and used in the analysis of both CS and IRL thickness. RESULTS Overall, 28 eyes of 14 patients with PD and 28 eyes of 14 HC subjects were included. Patient demographics are summarized in Table 1. Mean CS scores segregated by left eye, right eye, random eyes, and binocular vision compared by diagnosis (PD vs HC) demonstrated statistically signifi-cant decreased CS in PD eyes for all segregated parameters (P , 0.05). Assuming a linear relationship of age as a co-variate in the final ANCOVA model, mean CS scores by diagnosis are demonstrated in Table 2. Controlling for age within the ANCOVA analysis, CS differences between left eye and binocular scores among the groups approached statistical significance (Table 2). IRL thickness differences between PD and HC were statistically different in each of the 4 macular quadrants at various perifoveal locations. A summary of IRL thickness differences between the groups is presented in Figures 2 and 3. Bivariate analysis of randomized monocular CS by randomized IRL thickness evaluated by diagnosis revealed a significant correlation for only HC subjects at multiple foveal locations in all 4 macular quadrants from the foveal center. Location ranges and significance values were as follows: nasal quadrant, 0.75-1.00 mm (P , 0.02); tem-poral quadrant, 0.50-1.00 mm (P , 0.05); superior quad-rant, 1.00 mm (P , 0.05); inferior quadrant, 1.00 mm (P , 0.03). No significant correlation was found between CS and IRL thickness within patients with PD (P . 0.05 for each foveal location measured). TABLE 1. Patient demographics for Parkinson disease patients and healthy controls PD (n = 14) HC (n = 14) Mean age (SD)* 68.6 ± 6.4 64.4 ± 6.4 Men 7 7 Women 7 7 Caucasian 7 7 African American 6 5 Hispanic 1 2 *No significant difference between the groups via 2-tailed t test (P . 0.05). HC, healthy controls; PD, Parkinson disease patients. TABLE 2. Pelli-Robson contrast sensitivity evaluation by diagnosis Contrast Sensitivity PD HC P* Left eye 1.73 ± 0.25 1.90 ± 0.11 0.072 Right eye 1.67 ± 0.27 1.92 ± 0.09 0.015 Binocular 1.86 ± 0.18 1.98 ± 0.07 0.078 Random 1.67 ± 0.29 1.92 ± 0.09 0.021 Values are represented as mean ± standard deviation. *Analysis of covariance (age as linear covariate). HC, healthy controls; PD, Parkinson disease patients; random, randomly selected eyes. Adam et al: J Neuro-Ophthalmol 2013; 33: 137-142 139 Original Contribution Copyright © North American Neuro-Ophthalmology Society. Unauthorized reproduction of this article is prohibited. DISCUSSION The results our study are in agreement with previous reports indicating that age is a significant variable related to both IRL thickness (23,24) and CS (25-28). The progressive loss of ganglion cell axons throughout life is a well-described phenomenon and is a component of normal retinal aging (29-33). Compared with HC, however, it appears that eyes of patients with PD have a particularly thin parafoveal IRL, in agreement with recent reports (10). Retinal nerve fiber layer (RNFL) thinning in PD has been previously described (34). Subsequent investigations have confirmed retinal nerve fiber layer (RNFL) thinning in PD with various results and diagnostic yields (10,35-38). A majority of these studies con-centrated on the RNFL or total macular volumes and not on the inner cellular retina, which was the basis of our current investigation and the presumable location of dopaminergic amacrine cells implicit in CS function. We hypothesize that IRL thinning in PD may represent the combined result of accelerated normal age-related ganglion cell loss secondary to an underlying neurodegenerative process, transsynaptic degeneration from cortical and subcortical neuronal loss, or may represent the primary loss of dopaminergic neurons including amacrine cells and decreased retinal dopamine. Decreased levels of retinal dopamine have been reported in patients with PD (14-16,39), and dopaminergic neurons have been localized experimentally to the inner retina (13- 16,40). In addition, dopamine's role in multiple dopamine-dependent physiologic and neuronal trophic processes within the retina has been described, including cellular functional modulation, cell growth, and survival (17). Our findings of markedly decreased CS in patients with PD are consistent with multiple previous reports (5,6,19,39,41). Interestingly, while IRL thickness correlated with CS among HC subjects, we did not observe this correlation in PD eyes. We hypothesize that the lack of correlation between the observed CS deficit and foveal inner retinal thinning may be the result of simultaneous retinal and cortical dysfunction of the visual pathway occurring in PD. Our investigation was limited to monocular CS because of evidence documenting significant interocular asymmetry of foveal thickness in PD (42). These results indicate that while IRL and CS may simul-taneously be decreased, the functional deficit of dopaminergic interneurons, including amacrine cells, appears to outstrip the anatomic structural changes in the inner retina of PD. While the normal age-related loss of ganglion cell axons may underlie decreased CS in HC, we hypothesize that additional neuronal dysfunction contributes to the pathogenesis of decreased CS in patients with PD. This further supports the notion that there may be a primary degenerative retinal cellular abnormality in PD (17,20,43,44). The present study may have important implications regarding the clinical diagnosis and functional deficit in patients with PD. SD-OCT may be used to quantify IRL thickness, screen as a biomarker for high-risk patients, FIG. 2. Relationship of mean randomized inner retinal layer (IRL) thickness difference among patients with Parkinson disease (PD) and healthy controls (HC) measured by spec-tral- domain optical coherence tomography. *Significantly different IRL thickness from HC via analysis of covariance (age as a linear covariate); nasal quadrant, 21.25 to21.50 mm (P , 0.05); temporal quadrant, 1.50 to 2.00 mm (P , 0.05). FIG. 3. Relationship of mean randomized inner retinal layer (IRL) thickness differences among patients with Parkinson disease (PD) and healthy controls (HC) as measured by spectral-domain optical coherence tomography. *Signifi-cantly different IRL thickness from HC via analysis of covariance (age as a linear covariate); inferior quadrant, 21.00 to 21.75 mm (P , 0.04); superior quadrant, 1.00 to 1.75 mm (P , 0.03). 140 Adam et al: J Neuro-Ophthalmol 2013; 33: 137-142 Original Contribution Copyright © North American Neuro-Ophthalmology Society. Unauthorized reproduction of this article is prohibited. monitor disease progression, and evaluate effectiveness of neuroprotective therapies. However, it appears that the degree of CS decline present in PD may outweigh the SD-OCT findings. Further investigation should focus on the localization of specific dopaminergic cells and associated pathologic changes leading to distinct anatomic and bio-chemical markers within the inner retina of PD. Our prospective study is limited by relatively small sample size, assumption of a linear relationship between age and the studied variables, automated image segmentation of retinal tissue, quantification of only foveal IRL, and potentially unrecognized confounding variables. Neverthe-less, we conclude that both IRL thickness and CS appear to be markedly reduced in PD compared with that of HC. REFERENCES 1. Parkinson J. An essay on the shaking palsy. 1817. J Neuropsychiatry Clin Neurosci. 2002;14:223-236; discussion 222. 2. de Rijk MC, Breteler MM, Graveland GA, Ott A, Grobbee DE, van der Meche FG, Hofman A. Prevalence of Parkinson's disease in the elderly: the Rotterdam Study. Neurology. 1995;45:2143-2146. 3. Trenkwalder C, Schwarz J, Gebhard J, Ruland D, Trenkwalder P, Hense HW, Oertel WH. Starnberg trial on epidemiology of parkinsonism and hypertension in the elderly. Prevalence of Parkinson's disease and related disorders assessed by a door-to- door survey of inhabitants older than 65 years. Arch Neurol. 1995;52:1017-1022. 4. Shulman LM, Taback RL, Bean J, Weiner WJ. Comorbidity of the nonmotor symptoms of Parkinson's disease. Mov Disord. 2001;16:507-510. 5. Rodnitzky RL. Visual dysfunction in Parkinson's disease. Clin Neurosci. 1998;5:102-106. 6. Mestre D, Blin O, Serratrice G, Pailhous J. Spatiotemporal contrast sensitivity differs in normal aging and Parkinson's disease. Neurology. 1990;40:1710-1714. 7. Bodis-Wollner I, Yahr MD. Measurements of visual evoked potentials in Parkinson's disease. Brain. 1978;101: 661-671. 8. Tagliati M, Bodis-Wollner I, Yahr MD. The pattern electroretinogram in Parkinson's disease reveals lack of retinal spatial tuning. Electroencephalogr Clin Neurophysiol. 1996;100:1-11. 9. Pieri V, Diederich NJ, Raman R, Goetz CG. Decreased color discrimination and contrast sensitivity in Parkinson's disease. J Neurol Sci. 2000;172:7-11. 10. Hajee ME, March WF, Lazzaro DR, Wolnitz AH, Shier EM, Glazman S, Bodis-Wollner IG. Inner retinal layer thinning in Parkinson disease. Arch Ophthalmol. 2009;127:737-741. 11. Valenti DA. Neuroimaging of retinal nerve fiber layer in AD using optical coherence tomography. Neurology. 2007;69:1060. 12. Pulicken M, Gordon-Lipkin E, Balcer LJ, Frohman E, Cutter G, Calabresi PA. Optical coherence tomography and disease subtype in multiple sclerosis. Neurology. 2007;69:2085-2092. 13. Schutte M, Witkovsky P. Dopaminergic interplexiform cells and centrifugal fibres in the Xenopus retina. J Neurocytol. 1991;20:195-207. 14. Djamgoz MB, Hankins MW, Hirano J, Archer SN. Neurobiology of retinal dopamine in relation to degenerative states of the tissue. Vision Res. 1997;37:3509-3529. 15. Harnois C, Di Paolo T. Decreased dopamine in the retinas of patients with Parkinson's disease. Invest Ophthalmol Vis Sci. 1990;31:2473-2475. 16. Ikeda H, Head GM, Ellis CJK. Electrophysiological signs of retinal dopamine deficiency in recently diagnosed Parkinson's disease and a follow up study. Vision Res. 1994;34:2629- 2638. 17. Witkovsky P. Dopamine and retinal function. Doc Ophthalmol. 2004;108:17-40. 18. Wink B, Harris J. A model of the parkinsonian visual system: support for the dark adaptation hypothesis. Vision Res. 2000;40:1937-1946. 19. Ghilardi MF, Bodis-Wollner I, Onofrj MC, Marx MS, Glover AA. Spatial frequency dependent abnormalities of the pattern electroretinogram and visual evoked potentials in a parkinsonian monkey model. Brain. 1988;111:131-149. 20. Bodis-Wollner I, Marx MS, Mitra S, Bobak P, Mylin L, Yahr M. Visual dysfunction in Parkinson's disease. Loss in spatiotemporal contrast sensitivity. Brain. 1987;110:1675- 1698. 21. Watson AB. Gain, noise, and contrast sensitivity of linear visual neurons. Vis Neurosci. 1990;4:147-157. 22. Bodis-Wollner I, Spund B, Liu T, Shrier E, Selesnick I, Glazman S, Sohail N, Lazzaro D. Remodeling of the fovea in Parkinson disease. Invest Ophthalmol Vis Sci. 2011; 52:6660. 23. Alamouti B, Funk J. Retinal thickness decreases with age: an OCT study. Br J Ophthalmol. 2003;87:899-901. 24. Eriksson U, Alm A. Macular thickness decreases with age in normal eyes: a study on the macular thickness map protocol in the Stratus OCT. Br J Ophthalmol. 2009;93:1448-1452. 25. Crassini B, Brown B, Bowman K. Age-related changes in contrast sensitivity in central and peripheral retina. Perception. 1988;17:315-332. 26. Derefeldt G, Lennerstrand G, Lundh B. Age variations in normal human contrast sensitivity. Acta Ophthalmol (Copenh). 1979;57:679-690. 27. Elliott DB. Contrast sensitivity decline with ageing: a neural or optical phenomenon? Ophthalmic Physiol Opt. 1987;7:415- 419. 28. Ross JE, Clarke DD, Bron AJ. Effect of age on contrast sensitivity function: uniocular and binocular findings. Br J Ophthalmol. 1985;69:51-56. 29. Knight OJ, Girkin CA, Budenz DL, Durbin MK, Feuer WJ. Effect of race, age, and axial length on optic nerve head parameters and retinal nerve fiber layer thickness measured by Cirrus HD-OCT. Arch Ophthalmol. 2012;130:312-318. 30. Gao H, Hollyfield JG. Aging of the human retina. Differential loss of neurons and retinal pigment epithelial cells. Invest Ophthalmol Vis Sci. 1992;33:1-17. 31. Harman A, Abrahams B, Moore S, Hoskins R. Neuronal density in the human retinal ganglion cell layer from 16-77 years. Anat Rec. 2000;260:124-131. 32. Jonas JB, Schmidt AM, Muller-Bergh JA, Schlotzer- Schrehardt UM, Naumann GO. Human optic nerve fiber count and optic disc size. Invest Ophthalmol Vis Sci. 1992;33:2012- 2018. 33. Leung CK, Yu M, Weinreb RN, Ye C, Liu S, Lai G, Lam DS. Retinal nerve fiber layer imaging with spectral-domain optical coherence tomography: a prospective analysis of age- related loss. Ophthalmology. 2012;119:731-737. 34. Inzelberg R, Ramirez JA, Nisipeanu P, Ophir A. Retinal nerve fiber layer thinning in Parkinson disease. Vision Res. 2004;44:2793-2797. 35. Altintas O, Iseri P, Ozkan B, Caglar Y. Correlation between retinal morphological and functional findings and clinical severity in Parkinsons Disease. Doc Ophthalmol. 2008;1116:137-146. 36. Aaker GD, Myung JS, Ehrlich JR, Mohammed M, Henchcliffe C, Kiss S. Detection of retinal changes in Parkinson's disease with spectral-domain optical coherence tomography. Clin Ophthalmol. 2010;4:1427-1432. 37. La Morgia C, Barboni P, Rizzo G, Carbonelli M, Savini G, Scaglione G, Capellari S, Bonazza S, Giannoccaro MP, Calandra-Buonaura G, Liguior R, Cortelli P, Martinelli P, Barruzi A, Catelli V. Loss of temporal retinal nerve fibers in Parkinson disease: a mitochondrial pattern? Eur J Neurol. 2013;20:198-201. Adam et al: J Neuro-Ophthalmol 2013; 33: 137-142 141 Original Contribution Copyright © North American Neuro-Ophthalmology Society. Unauthorized reproduction of this article is prohibited. 38. Bodis-Wollner I, Spund B, Liu T, Shrier EM, Javaid M, Glazman S. Remodeling of the fovea in Parkinson disease. Invest Ophthalmol Vis Sci. 2011;52:e-abstract 6660. 39. Moschos MM, Tagaris G, Markopoulos I, Margetis I, Tsapakis S, Kanakis M, Koutsandrea C. Morphologic changes and functional retinal impairment in patients with Parkinson disease without visual loss. Eur J Ophthalmol. 2011;21:24-29. 40. Reader TA, Quesney LF. Dopamine in the visual cortex of the cat. Experientia. 1986;42:1242-1244. 41. Regan D, Maxner C. Orientation-selective visual loss in patients with Parkinson's disease. Brain. 1987;110:415-432. 42. Shrier E, Adam C, Spund B, Glazman S, Bodis-Wollner I. Intraocular asymmetry of foveal thickness in Parkinson disease. J Ophthalmol. 2012;2012:728457. 43. Bodis-Wollner I. Visual deficits related to dopamine deficiency in experimental animals and Parkinson's disease patients. Trends Neurosci. 1990;13:296-302. 44. Bodis-Wollner I. Retinopathy in Parkinson disease. J Neural Transm. 2009;116:1493-1501. 142 Adam et al: J Neuro-Ophthalmol 2013; 33: 137-142 Original Contribution Copyright © North American Neuro-Ophthalmology Society. Unauthorized reproduction of this article is prohibited. |