| Title |
The Effects of Coal Particle Size on Reductions of NOx and Unburnt Carbon |
| Creator |
Ohyatsu, Noriyuki; Okiura, Kunio; Akiyama, Iwao |
| Publisher |
University of Utah |
| Date |
1991 |
| Spatial Coverage |
presented at Honolulu, Hawaii |
| Abstract |
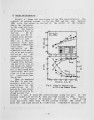
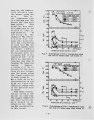
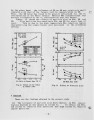
For pulverized coal combustion, it is well known that the particle size influences the combustion rate and a smaller particle size gives a higher combustion efficiency. However, the effect of particle size on NOx reduction is not always obvious. Then we evaluated the effects of particle size on reductions of NOx and unburnt carbon in fly ash using our low NOx burner. We measured the NOx behavior in a single-burner furnace and the combustion characteristics in a multi-burner furnace. The main results we obtained are as follows. The variation of NOx reduction with particle size was greatly affected by the excess O2 concentration using this burner. That is, the NOx concentration became lower for finer particle sizes at low excess O2 concentrations whereas it became higher for finer particle sizes at high excess O2 concentrations. We also found from the multi-burner test with the two staged combustion that both NOx and unburnt carbon in fly ash decreased with decreasing the particle size. |
| Type |
Text |
| Format |
application/pdf |
| Language |
eng |
| Rights |
This material may be protected by copyright. Permission required for use in any form. For further information please contact the American Flame Research Committee. |
| Conversion Specifications |
Original scanned with Canon EOS-1Ds Mark II, 16.7 megapixel digital camera and saved as 400 ppi uncompressed TIFF, 16 bit depth. |
| Scanning Technician |
Cliodhna Davis |
| ARK |
ark:/87278/s6rn3bf0 |
| Setname |
uu_afrc |
| ID |
6735 |
| Reference URL |
https://collections.lib.utah.edu/ark:/87278/s6rn3bf0 |