| Title |
A Summary of Air Toxic Emissions from Natural Gas-Fired Combustion Turbines |
| Creator |
Fangmeier, Bruce A.; Himes, Richard M.; McDannel, Mark D.; Lott, Robert A.; Toole-O'Neil, Barbara |
| Publisher |
University of Utah |
| Date |
1994 |
| Spatial Coverage |
presented at Maui, Hawaii |
| Abstract |
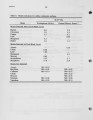
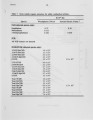
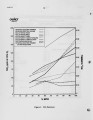
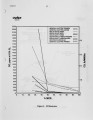
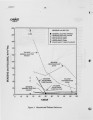
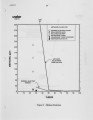
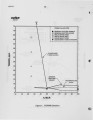
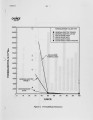
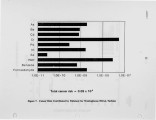
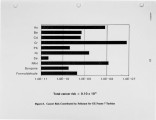
The Clean Air Act Amendments (CAAA) of 1990 have imposed more stringent emission controls and reporting requirements that effect both industry and utilities. In addition to criteria pollutants ( e .g., NOx, CO, S02, VOCs, and particulate matter) addressed under Titles I and IV, the CAAA have also potentially identified a whole new class of air toxic emissions under Title Ill for possible control and mitigation. With respect to reporting requirements, Title V establishes a Federally enforceable facility operating permit program for all major sources of air pollutants (criteria and toxic). Each major source needs to characterize emission levels for all regulated pollutants. As air toxic emissions data with sufficiently low detection limits is very scarce, the current study focused on quantifying air toxic emissions from natural gas-fired boilers and turbines. The current paper presents the results collected from a broad range of gas turbine models and power ratings by Carnot as part of a series of programs funded by a natural gas pipeline transmission company, the Gas Research Institute, and the Electric Power Research Institute. In sum, the results show relatively low pollutant emissions under full load operation. At 50% maximum continuous rating, however, CO and formaldehyde emissions increase exponentially. Although these operating regimes a r e rarely encountered under electric utility operating scenarios, natural gas compressor stations cycle over a much broader power range in order to match natural gas supply with demand. In addition, these results are suggestive of a temperature threshold under which natural gas combustion is incomplete leading to increased emission levels of CO and formaldehyde. |
| Type |
Text |
| Format |
application/pdf |
| Language |
eng |
| Rights |
This material may be protected by copyright. Permission required for use in any form. For further information please contact the American Flame Research Committee. |
| Conversion Specifications |
Original scanned with Canon EOS-1Ds Mark II, 16.7 megapixel digital camera and saved as 400 ppi uncompressed TIFF, 16 bit depth. |
| Scanning Technician |
Cliodhna Davis |
| ARK |
ark:/87278/s64b33xp |
| Setname |
uu_afrc |
| ID |
8766 |
| Reference URL |
https://collections.lib.utah.edu/ark:/87278/s64b33xp |