Technical reports, manuscripts and photographs document the early history of the University of Utah Computer Science Department.
TO
Filters: Collection: ir_computersa
| Title | Description | Subject | Date | ||
|---|---|---|---|---|---|
| 451 |
 |
Page 29 | |||
| 452 |
 |
Page 31 | |||
| 453 |
 |
Page 33 | |||
| 454 |
 |
Page 34 | |||
| 455 |
 |
Page 38 | |||
| 456 |
 |
Page 38 | |||
| 457 |
 |
Page 41 | |||
| 458 |
 |
Page 41 | |||
| 459 |
 |
Page 45 | |||
| 460 |
 |
Page 46 | |||
| 461 |
 |
Page 48 | |||
| 462 |
 |
Page 60 | |||
| 463 |
 |
Page 70 | |||
| 464 |
 |
Page 71 | |||
| 465 |
 |
Page 71 | |||
| 466 |
 |
Page 75 | |||
| 467 |
 |
Page 78 | |||
| 468 |
 |
Page 94 | |||
| 469 |
 |
Page 95 | |||
| 470 |
 |
Page 98 | |||
| 471 |
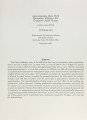 |
Approximating data with parametric B-splines for computer aided design | This thesis addresses some of the difficulties that can be encountered when approximation is used as a design tool. In many cases, it is most intuitive for a designer to specify points on or near a desired contour, and approximate them with a curve. Merely computing some approximation to a set of da... | computer graphics; computer-aided design; approximation theory; B-splines | 1985-12 |
| 472 |
 |
Interactive volume visualization | The purpose of scientific computation is insight. Visualization is the most direct way to bring out and deliver insight. The advances of technology have allowed scientists to simulate or observe our physical world at a much higher resolution than was available previously. As a result, large-scale nu... | computer graphics; volume visualization | 1993-06 |
| 473 |
 |
Page 105 | |||
| 474 |
 |
Page 11 | |||
| 475 |
 |
Page 117 |