TO
Filters: Collection: "ir_uspace"
| Creator | Title | Description | Subject | Date | ||
|---|---|---|---|---|---|---|
| 1 |
 | Freire, Juliana; Silva, Claudio T. | Provenance for visualizations: reproducibility and beyond | The demand for the construction of complex visualizations is growing in many disciplines of science, as users are faced with ever increasing volumes of data to analyze. The authors present VisTrails, an open source provenance-management system that provides infrastructure for data exploration and ... | Provenance management; Reproducibility; VisTrails; Pipelines | 2007-09 |
| 2 |
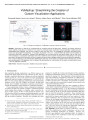
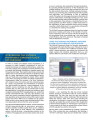 | Freire, Juliana | Introducing the VisTrails Provenance Explorer Plugin for ParaView | In order to analyze and validate various hypotheses, it is necessary to create insightful visualizations of both the simulated processes and observed phenomena, using powerful data analysis and visualization tools like ParaView. But to explore data through visualization, scientists need to go thro... | VisTrails; Provenance; ParaView | 2009 |
| 3 |
 | Freire, Juliana; Silva, Claudio T. | Querying and creating visualizations by analogy | While there have been advances in visualization systems, particularly in multi-view visualizations and visual exploration, the process of building visualizations remains a major bottleneck in data exploration. We show that provenance metadata collected during the creation of pipelines can be reused ... | Provenance; VisTrails; Pipelines; Query-by-example | 2007-11 |
| 4 |
 | Freire, Juliana; Silva, Claudio T. | VisTrails: enabling interactive multiple-view visualizations | VisTrails is a new system that enables interactive multiple-view visualizations by simplifying the creation and maintenance of visualization pipelines, and by optimizing their execution. It provides a general infrastructure that can be combined with existing visualization systems and libraries. A ke... | VisTrails; Dataflows; Pipelines; Provenance management; Interrogative visualization; Caching; Coordinated views | 2005 |
| 5 |
 | Freire, Juliana; Silva, Claudio T. | Managing the evolution of dataflows with VisTrails | Scientists are now faced with an incredible volume of data to analyze. To successfully analyze and validate various hypotheses, it is necessary to pose several queries, correlate disparate data, and create insightful visualizations of both the simulated processes and observed phenomena. Data explor... | VisTrails; Dataflows; Provenance management | 2006 |
| 6 |
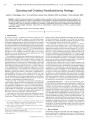
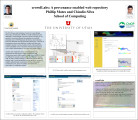 | Mates, Phillip Lopes; Silva, Claudio T. | crowdLabs: a provenance enabled web repository | The National Science Foundation Science and Technology Center for Coastal Margin Observation and Prediction (CMPO) is a multi-institutional center dedicated to coastal margins, which are regions consisting of very productive ecosystems that play an important role in global elemental cycles. CMPO ma... | CrowdLabs; Web repository; Coastal margins; Trapeze Interactive Poster | 2010-03-15 |
| 7 |
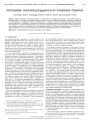
 | Freire, Juliana; Silva, Claudio T. | VisMashup: streamlining the creation of custom visualization applications | Visualization is essential for understanding the increasing volumes of digital data. However, the process required to create insightful visualizations is involved and time consuming. Although several visualization tools are available, including tools with sophisticated visual interfaces, they are o... | VisMashup; Dataflow; Visualization systems; Mashups; Medleys | 2009-11 |
| 8 |
 | Freire, Juliana; Silva, Claudio T. | VisComplete: automating suggestions for visualization pipelines | Building visualization and analysis pipelines is a large hurdle in the adoption of visualization and workflow systems by domain scientists. In this paper, we propose techniques to help users construct pipelines by consensus-automatically suggesting completions based on a database of previously creat... | VisComplete; Workflows; Auto completion; Visualization pipelines | 2008-11 |
| 9 |
 | Tasdizen, Tolga | Long range digital neural circuit reconstruction | 2012 | ||
| 10 |
 | Woolcott, Liz; Myntti, Jeremy | Now, What Do You Want Me to Do?: New and Emerging Roles for Cataloging and Metadata Librarians | Presentation given at the ALCTS Exchange online event. | Cataloging; Libraries | 2017-05-09 |
| 11 |
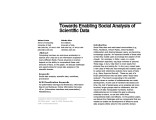 | Freire, Juliana; Silva, Claudio T. | Towards enabling social analysis of scientific data | Flickr, Facebook, Yahoo! Pipes), which facilitate collaboration and sharing between users, are becoming increasingly popular. An important benefit of these sites is that they enable users to leverage the wisdom of the crowds. For example, in Flickr, users, in a mass collaboration approach, tag ... | Social data analysis; Scientific data; Workflows; Provenance; Pipelines; VisTrails | 2008 |
| 12 |
 | Meyer, Miriah Dawn | Visualizing data: why an (interactive) picture is worth 1000 numbers | One of the most striking and unique aspects about this moment in human history is the amount of data we are generating. This data holds the promise of unlocking the mysteries of the universe, untangling complex natural and man-made systems, and allowing us to live longer, healthier, and more product... | 2012-09-05 | |
| 13 |
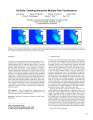
 | Gerig, Guido | Normative modeling of early brain maturation from longitudinal DTI reveals twin-singleton differences | Early brain development of white matter is characterized by rapid organization and structuring. Magnetic Resonance diffusion tensor imaging (MR-DTI) provides the possibility of capturing these changes non-invasively by following individuals longitudinally in order to better understand departures fro... | 2014-01-01 | |
| 14 |
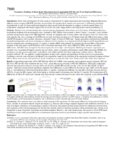
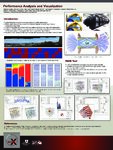 | Pascucci, Valerio | Performance Analysis and Visualization | 2012 | ||
| 15 |
 | Parker, Steven G.; Hansen, Charles D. | Interactive volume rendering of large datasets using the silicon graphics Onyx4 visualization system | Many recent approaches to interactive volume rendering have focused on leveraging the power of commodity graphics hardware. Though currently limited to relatively small datasets, these approaches have been overwhelmingly successful. As the size of volumetric datasets continues to grow at a rapid pa... | Volume visualization; Onyx4; Interactive volume rendering; Parallel volume rendering; Large datasets; Visualization systems | 2005 |
| 16 |
 | Johnson, Christopher R. | Computer simulation and visualization in medicine | The goals of medical simulation and visualization are multifaceted. While some simulations and visualizations facilitate diagnosis, others help physicians plan surgery, therapy, and other forms of treatment. Still other simulation and visualization techniques are used for medical training and to acq... | Technology; Computer assisted instruction; Computer graphics | 2000 |
| 17 |
 | Johnson, Christopher R.; Parker, Steven G.; Whitaker, Ross T.; Hansen, Charles D. | Computational field visualization | Today, scientists, engineers, and medical researchers routinely use computers to simulate complex physical phenomena. Such simulations present new challenges for computational scientists, including the need to effectively analyze and visualize complex three-dimensional data. As simulations become mo... | Volume rendering; Isosurface extraction; Ray tracing; Multi-field visualizations | 2001 |
| 18 |
| Parker, Steven G.; Hansen, Charles D. | Interactive volume rendering of large datasets using the silicon graphics Onyx4 visualization system | Many recent approaches to interactive volume rendering have focused on leveraging the power of commodity graphics hardware. Though currently limited to relatively small datasets, these approaches have been overwhelmingly successful. As the size of volumetric datasets continues to grow at a rapid ... | Interactive volume; Rendering; Large datasets; Onyx4; Silicon graphics | 2004-01-27 |
| 19 |
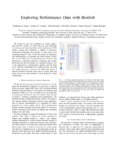 | Pascucci, Valerio | Exploring performance data with boxfish | The growth in size and complexity of scaling applications and the systems on which they run pose challenges in analyzing and improving their overall performance. With metrics coming from thousands or millions of processes, visualization techniques are necessary to make sense of the increasing amount... | 2012-01-01 | |
| 20 |
 | Freire, Juliana; Silva, Claudio T. | End-to-end eScience: integrating workflow, query, visualization, and provenance at an ocean observatory | Data analysis tasks at an Ocean Observatory require integrative and and domain-specialized use of database, workflow, visualization systems. We describe a platform to support these tasks developed as part of the cyberinfrastructure at the NSF Science and Technology Center for Coastal Margin Obser... | Coastal margins; Ocean observatories; Workflow systems; VisTrails | 2008-12 |
| 21 |
 | Pascucci, Valerio | Flow visualization with quantified spatial and temporal errors using edge maps | Robust analysis of vector fields has been established as an important tool for deriving insights from the complex systems these fields model. Traditional analysis and visualization techniques rely primarily on computing streamlines through numerical integration. The inherent numerical errors of such... | 2012-01-01 | |
| 22 |
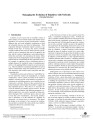
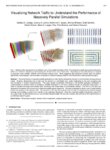 | Pascucci, Valerio | Visualizing network traffic to understand the performance of massively parallel simulations | The performance of massively parallel applications is often heavily impacted by the cost of communication among compute nodes. However, determining how to best use the network is a formidable task, made challenging by the ever increasing size and complexity of modern supercomputers. This paper appli... | 2012-01-01 | |
| 23 |
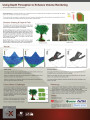 | Hansen, Charles D. | Using Depth Perception to Enhance Volume Rendering | 2012 | ||
| 24 |
 | Freire, Juliana; Silva, Claudio T. | Enabling advanced visualization tools in a web-based simulation monitoring system | Simulations that require massive amounts of computing power and generate tens of terabytes of data are now part of the daily lives of scientists. Analyzing and visualizing the results of these simulations as they are computed can lead not only to early insights but also to useful knowledge that ca... | Isosurfaces; Contour tree; Turbulent combustion; eSimMon | 2009-12 |
| 25 |
 | Anderson, Erik Wesley | Using EEG to Investigate the Visual Properties of Images | 2012 |