Filters: Journal Title:"IEEE Transactions on Visualization and Computer Graphics" Collection:"ir_uspace" Type:"Text"
1 - 25 of 13
Number of results to display per page
| Creator | Title | Description | Subject | Date | ||
|---|---|---|---|---|---|---|
| 1 |  | Hansen, Charles D. | Flow charts: visualization of vector fields on arbitrary surfaces | We introduce a novel flow visualization method called Flow Charts, which uses a texture atlas approach for the visualization of flows defined over curved surfaces. In this scheme, the surface and its associated flow are segmented into overlapping patches, which are then parameterized and packed in ... | 2008-09 | |
| 2 | 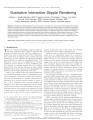 | Hansen, Charles D. | Illustrative interactive stipple rendering | Abstract-Simulating hand-drawn illustration can succinctly express information in a manner that is communicative and informative. We present a framework for an interactive direct stipple rendering of volume and surface-based objects. By combining the principles of artistic and scientific illustratio... | 2003-04 | |
| 3 |  | Hansen, Charles D. | Interactive display of isosurfaces with global illumination | Abstract-In many applications, volumetric data sets are examined by displaying isosurfaces, surfaces where the data, or some function of the data, takes on a given value. Interactive applications typically use local lighting models to render such surfaces. This work introduces a method to precompute... | 2006-03 | |
| 4 | 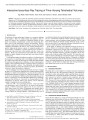 | Hansen, Charles D.; Wald, Ingo | Interactive isosurface ray tracing of time-varying tetrahedral volumes | Abstract- We describe a system for interactively rendering isosurfaces of tetrahedral finite-element scalar fields using coherent ray tracing techniques on the CPU. By employing state-of-the art methods in polygonal ray tracing, namely aggressive packet/frustum traversal of a bounding volume hierarc... | 2007-11 | |
| 5 |  | Hansen, Charles D.; Chien, Chi-Bin | Interactive visualization tool for multi-channel confocal microscopy data in neurobiology research | Confocal microscopy is widely used in neurobiology for studying the three-dimensional structure of the nervous system. Confocal image data are often multi-channel, with each channel resulting from a different fluorescent dye or fluorescent protein; one channel may have dense data, while another has ... | Volume rendering; Zebrafish | 2009-11 |
| 6 |  | Hansen, Charles D. | Model for volume lighting and modeling | Abstract-Direct volume rendering is a commonly used technique in visualization applications. Many of these applications require sophisticated shading models to capture subtle lighting effects and characteristics of volumetric data and materials. For many volumes, homogeneous regions pose problems f... | 2003-04 | |
| 7 |  | Hansen, Charles D. | Multidimensional transfer functions for interactive volume rendering | Abstract-Most direct volume renderings produced today employ one-dimensional transfer functions which assign color and opacity to the volume based solely on the single scalar quantity which comprises the data set. Though they have not received widespread attention, multidimensional transfer function... | 2002-07 | |
| 8 | 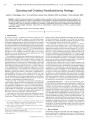 | Freire, Juliana; Silva, Claudio T. | Querying and creating visualizations by analogy | While there have been advances in visualization systems, particularly in multi-view visualizations and visual exploration, the process of building visualizations remains a major bottleneck in data exploration. We show that provenance metadata collected during the creation of pipelines can be reused ... | Provenance; VisTrails; Pipelines; Query-by-example | 2007-11 |
| 9 | 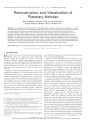 | Hansen, Charles D. | Reconstruction and visualization of planetary nebulae | Abstract-From our terrestrially confined viewpoint, the actual three-dimensional shape of distant astronomical objects is, in general, very challenging to determine. For one class of astronomical objects, however, spatial structure can be recovered from conventional 2D images alone. So-called planet... | 2005-09 | |
| 10 | 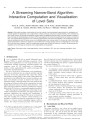 | Hansen, Charles D.; Whitaker, Ross T. | Streaming narrow-band algorithm: interactive computation and visualization of level sets | Abstract-Deformable isosurfaces, implemented with level-set methods, have demonstrated a great potential in visualization and computer graphics for applications such as segmentation, surface processing, and physically-based modeling. Their usefulness has been limited, however, by their high computa... | 2004-07 | |
| 11 | 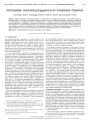 | Freire, Juliana; Silva, Claudio T. | VisComplete: automating suggestions for visualization pipelines | Building visualization and analysis pipelines is a large hurdle in the adoption of visualization and workflow systems by domain scientists. In this paper, we propose techniques to help users construct pipelines by consensus-automatically suggesting completions based on a database of previously creat... | VisComplete; Workflows; Auto completion; Visualization pipelines | 2008-11 |
| 12 | 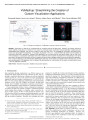 | Freire, Juliana; Silva, Claudio T. | VisMashup: streamlining the creation of custom visualization applications | Visualization is essential for understanding the increasing volumes of digital data. However, the process required to create insightful visualizations is involved and time consuming. Although several visualization tools are available, including tools with sophisticated visual interfaces, they are o... | VisMashup; Dataflow; Visualization systems; Mashups; Medleys | 2009-11 |
| 13 | 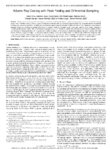 | Hansen, Charles D. | Volume Ray casting with peak finding and differential sampling | Direct volume rendering and isosurfacing are ubiquitous rendering techniques in scientific visualization, commonly employed in imaging 3D data from simulation and scan sources. Conventionally, these methods have been treated as separate modalities, necessitating different sampling strategies and ren... | 2009-11 |
1 - 25 of 13