| OCR Text |
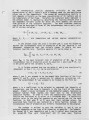
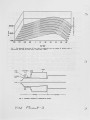
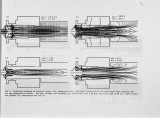
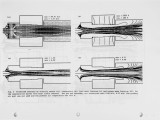
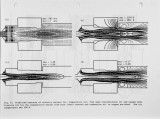
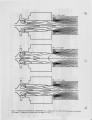
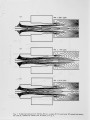
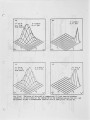
Show respectively. At each step during two interactions, the extreme limits of VI and V2 were calculated and the integration in equation 8 was obtained over the whole range of Vl and V2 at the interaction step in question. Equa t ion 6 was d i scret i sed by the upwi nd -d i fference techn i que to en sure full y numeri call y- stab 1 e sol ut ions. The algebra i c equat ion deri ved from discretisation of equation 4 formed a tri-diagonal banded matrix which was subsequently inverted by stone technique (19). The FLUENT reacting fluid flow mode 11 i ng package was used on a computer to obta in vel oc i ty and temperature fi e 1 ds. The post-process i ng package was then 1 inked to the output to obtain distribution of NO concentrations. 5. VALIDATION OF THE MODEL WITH REGENERATIVE BURNER DATA The post-processing code described above was validated against experimental data supplied by an industrial company. In their study a regenerative ceramic burner system firing into a process furnace was used. The regenerative burner supplied the preheated combustion air of temperature 17700K. The 25 therm regenerative burner was fired in a process furnace which was fibre insulated with internal dimensions of 1.64 (m) x 1.04 (m) and length of 3.2 (m). The burner was operated at 0.733 MW wi th 10% excess air preheated to 1273K, fi ri ng natural gas. The gas was supplied at the centre of preheat combustion air stream, where there were multi preheated air injection ports. Figure 2 shows a schematic of burner design with a changeable air injection port to investigate the effect of operating the parameter on the NO emission. The exhaust gas composition was measured in the sampling port located after the regenerator and some of the results obtained are summarised in Table 1. 5.1 Mathemat i cal Mode 11 i ng of the Burner: For the burner performance simulation the general purpose multiphase fluid dynamic code FLUENT V. 3.02 (20) was used. This code calculates the temperature and velocity flow field, species concentrations (C02, CO, H20, CH4 , 02' N2) and heat transfer by solving discretised equations at a point on a grid covering the geometry. The computational non-uniform grid consisted of 100 x 33 cells representing a 90° symmetrical sector of the burner. The turbulence of the gas flow was modelled with the (K-€) model. 5.2 Computer prediction of NO emissions: The predicted results for the flow fi e 1 d, temperature, fuel and oxygen concentrat i on at two di fferent pri mary and secondary air vel oc it i es and changes in burner des i gn are shown in Figs. 3(a-d) and 4(a-d). Finally, the use of the oxygenenrichment technique in place of the air preheating technique, was investigated by replacing the preheated primary air with 6% oxygenenriched air. The air/fuel ratio was adjusted to obtain the same level of oxygen concentration on the flue gas. The predicted velocity field temperature , fuel and oxygen concentrat ions wi th oxygen-enri ched pr; mary air are shown in Figs. 5(a-d). ~ Figures 6(a-c) show a two-dimensional projection of predicted thermal, prompt and total NO concentration across the burner and part of the furnace, when the effect of turbulence and superequilibrium radical format i on on the react i on rate is cons i dered. The resul t shows that the thermal-NO is formed mainly at the edge of the flame near the stoichiometric region where the flame temperature is close to its maximum va 1 ue and concentrat i on of ° and OH are s; gn if; cant. The thermal NO is produced rna in 1 yin the reg; on where pri mary and secondary a; rand fuel are react i ng. It is interest i ng to note that the NO product; on rate is 8 |