| Title |
Influence of Operating Conditions and Coal Characteristics on Ash Deposition in a Pilot-Scale Combustor |
| Creator |
Mai, M. C. |
| Publisher |
University of Utah |
| Date |
1988 |
| Spatial Coverage |
presented at Pittsburgh, Pennsylvania |
| Abstract |
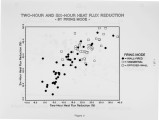
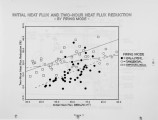
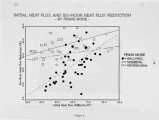
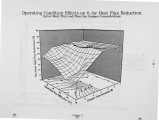
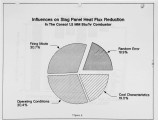
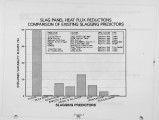
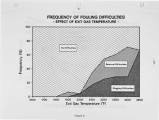
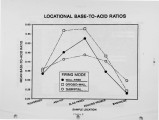
An initia1 study has been comp1eted describing ash deposition re1ated phenomena in a pilot-scale (1.5 MM Btu/hr) combustor. Statistical analyses were performed on slagging and fouling data from over 130 combustion tests using 33 different fuels. Slagging-induced heat flux reductions to a simulated water-wall were found to be highly dependent on operating conditions and firing mode (wall, opposed-wall, tangential) and less significantly related to coal characteristics. Fouling problems (in the form of tenacious deposits and/or convection section pressure drop difficulties) were found to be related to exit gas temperature, as-fired ASTM fusion temperature, ash loading, and fly ash mass-median particle size. Bulk deposit elemental ash oxide composition was found to be related to location, operating conditions and coal characteristics. The results, although somewhat intuitive, suggest that substantial improvements in the predictive accuracy of slagging and fouling correlations may be possible. In empirical terms this will require the inclusion of additional coal chemical/physical characteristic parameters and a continued evaluation of the importance of operating condition effects (temperatures, flow patterns, particle size distributions, etc.) on ash deposition related phenomena. |
| Type |
Text |
| Format |
application/pdf |
| Language |
eng |
| Rights |
This material may be protected by copyright. Permission required for use in any form. For further information please contact the American Flame Research Committee. |
| Conversion Specifications |
Original scanned with Canon EOS-1Ds Mark II, 16.7 megapixel digital camera and saved as 400 ppi uncompressed TIFF, 16 bit depth. |
| Scanning Technician |
Cliodhna Davis |
| ARK |
ark:/87278/s6gm89v1 |
| Setname |
uu_afrc |
| ID |
5057 |
| Reference URL |
https://collections.lib.utah.edu/ark:/87278/s6gm89v1 |


