| OCR Text |
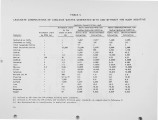
Show N CT\ TABLE 5 LEACHATE COMPOSITIONS OF COOLSIDE WASTES GENERATED WITH AND WITHOUT THE NaOH ADDITIVE Leachate Concentration a mg/L Allowltble Limit Waste Generated With the Waste Generated Without the by the Sodium H~droxide Additive Sodium H~droxide Additive Allowable Limit State of Ohio Acetic Acid Deionized Water Acetic Acid Deionized Water Analysis by RCRA (a) (b) Extraction Extraction Extraction Extraction Hydroxide as CaCO) 1,267 2,817 1,680 2,035 Carbonate as CaCO) <20 126 <20 212 Total Suspended Solids 17 3 15 3 Total Dissolved Solids 15,000 12,598 5,478 9,868 2,688 Calcium 2,676 895 2,961 1,155 Sodium 1,245 1,320 48.8 43.3 Arsenic 5 1.5 0.003 0.001 <0.005 0.001 Barium 100 30 <0.4 0.35 0.52 0.51 Cadmium 1 0.3 0.0006 0.0007 0.0009 0.0008 Chromium 5 1.5 0.13 0.099 0.10 0.082 lead 5 1.5 0.0031 0.0019 0.0029 0.0015 Mercury 0.2 0.06 0.0001 0.0002 <0.0001 <0.0002 Silver 5 1.5 <0.025 <0.025 <0.025 <0.025 Selenium 0.3 <0.03 <0.05 <0.015 <0.008 Nitrate (as N) 300 (c) 1.0 (c) 2.0 Fluoride 42 to 72 (c) 0.01 (c) <0.01 Chloride 7,500 (c) 6.0 (c) 8.0 Sulfate 7,500 1,437 2,032 557 944 Iron 9 <0.2 <0.2 <0.2 <0.2 Zinc 150 0.059 <0.02 <0.02 <0.02 Manganese 1.5 <0.02 <0.02 <0.02 <0.02 Copper 30 0.068 0.020 0.029 0.023 (a) Defined as 100 times thp EPA primary drinking water standards. (b) Defined as 30 times the EPA primary and secondary rlrinking water standards, as communicated in Reference 9. (c) Not determined due to interferences in analytical procedure. /ls |


